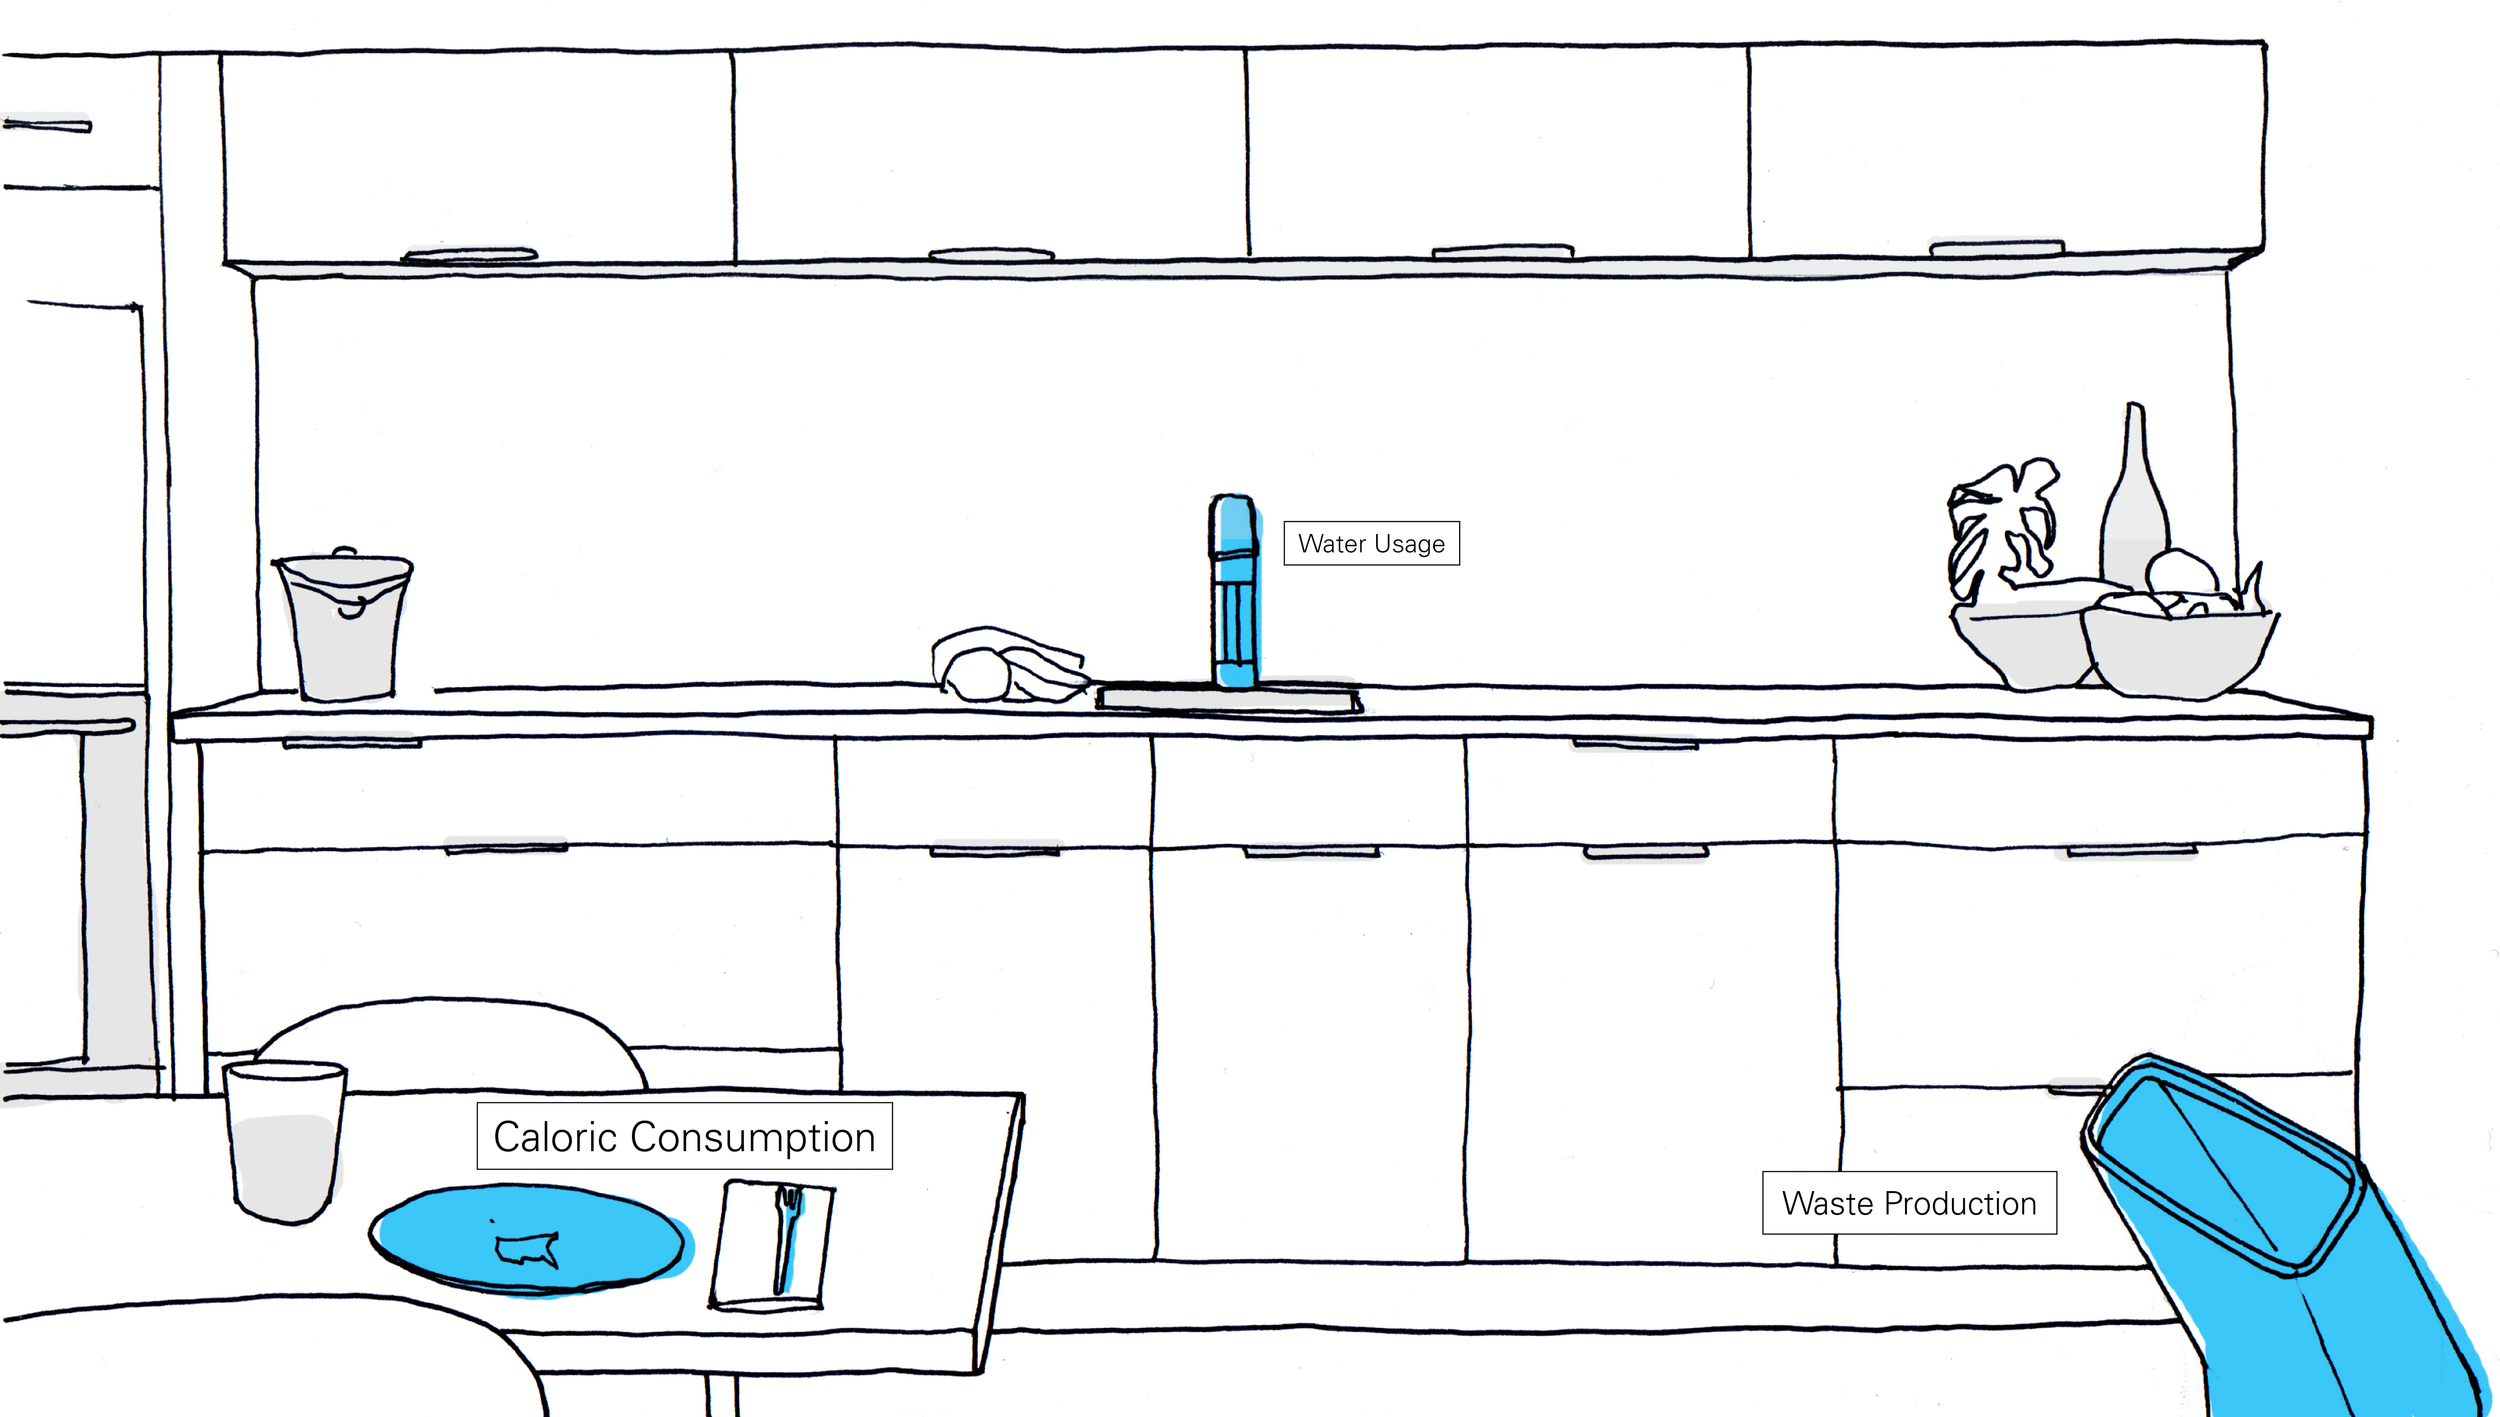
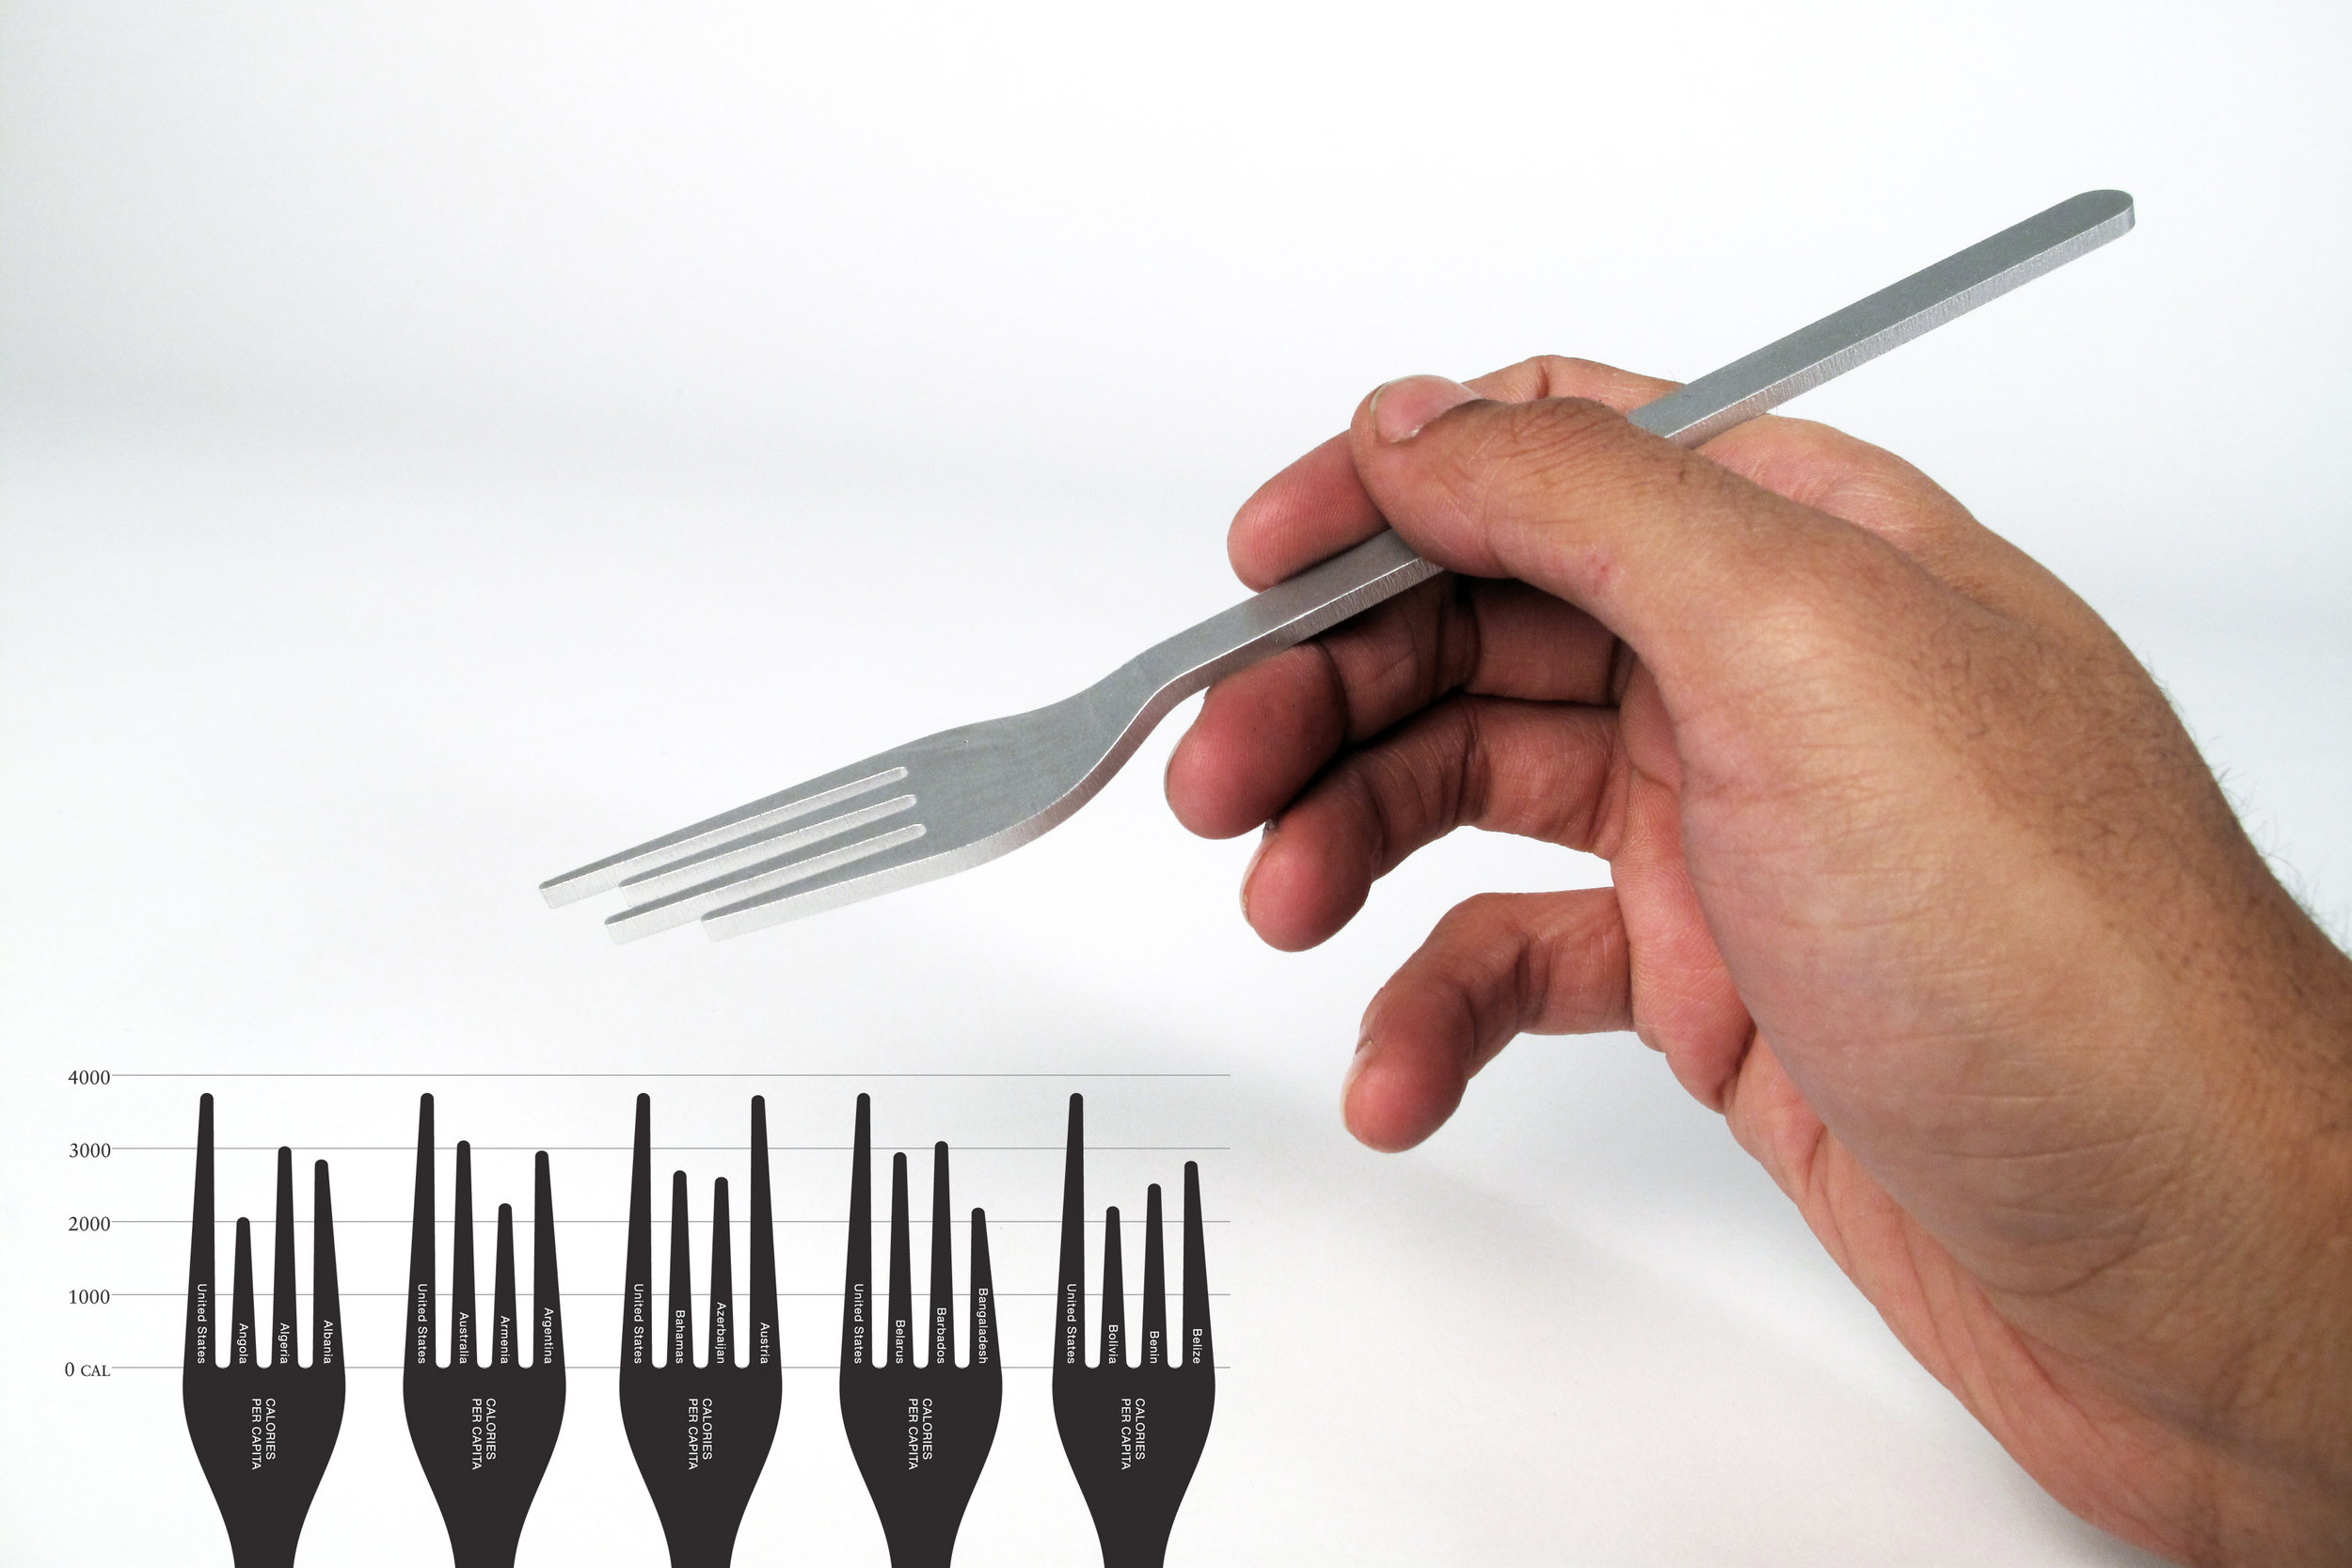
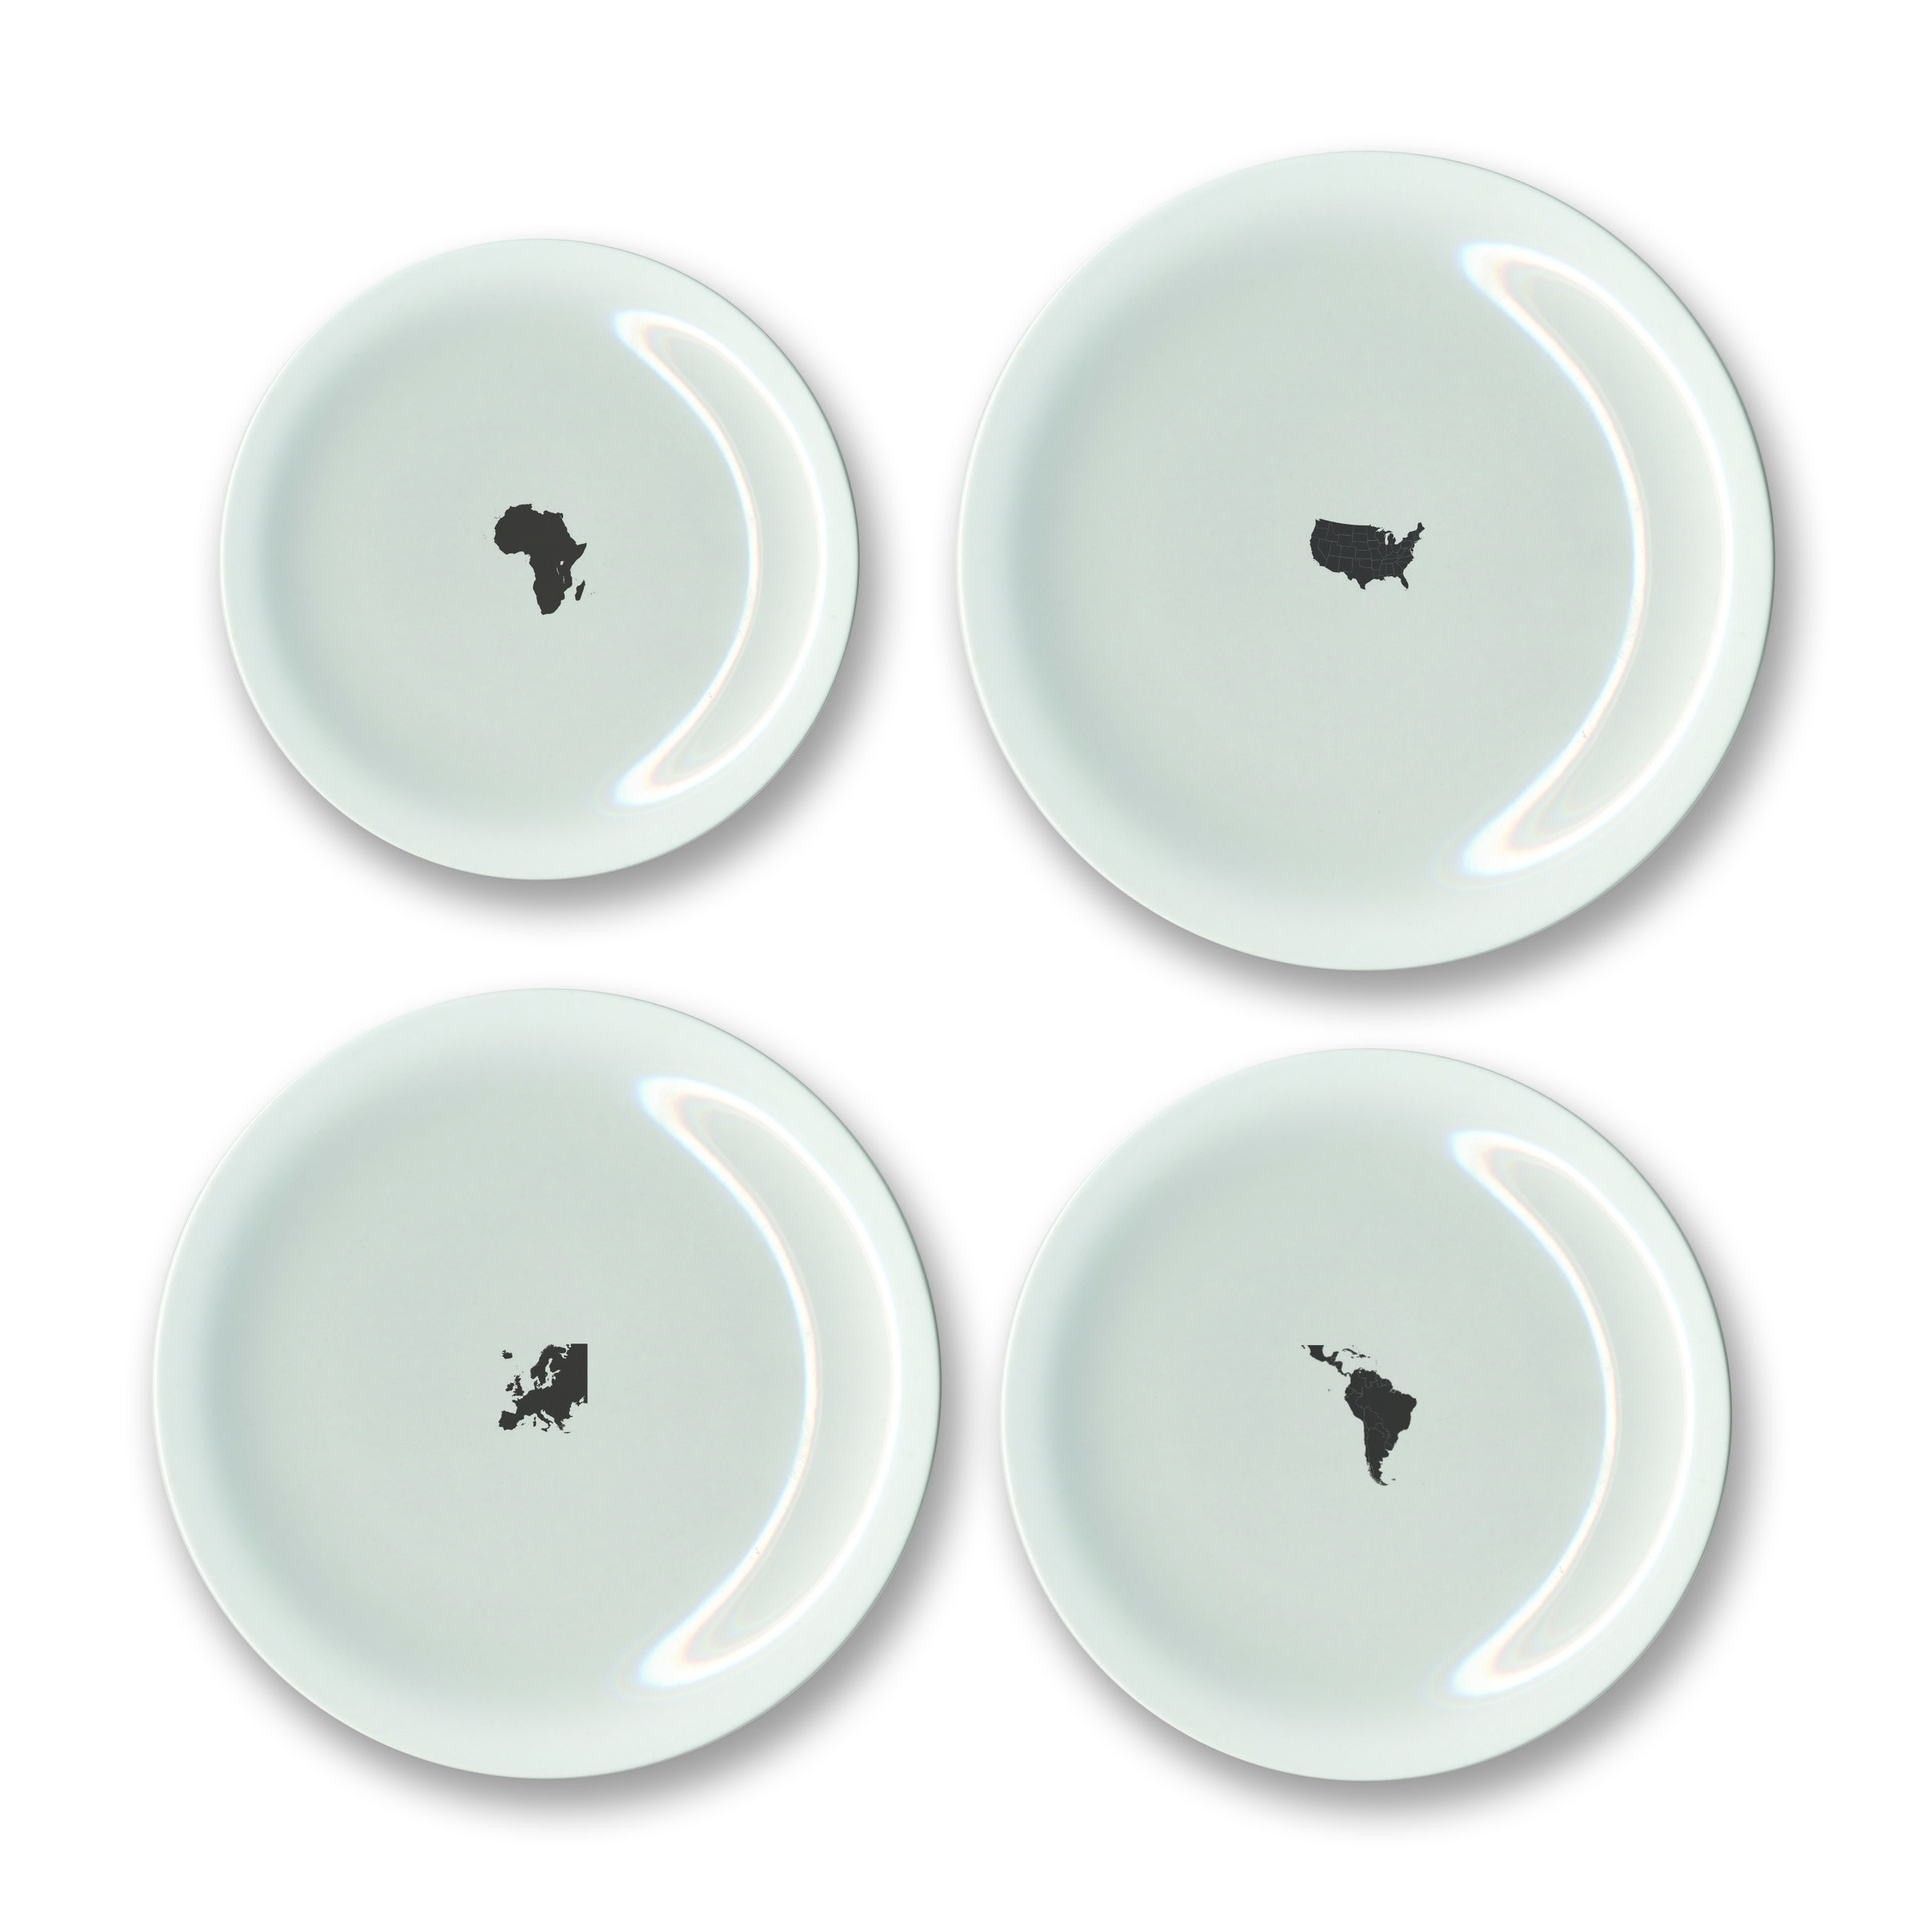
Caloric Consumption
The fork and plates visualize the caloric consumption per capita in various countries and regions. The information allows one to compare your culture’s eating habits to the rest of the world’s.
Water Usage
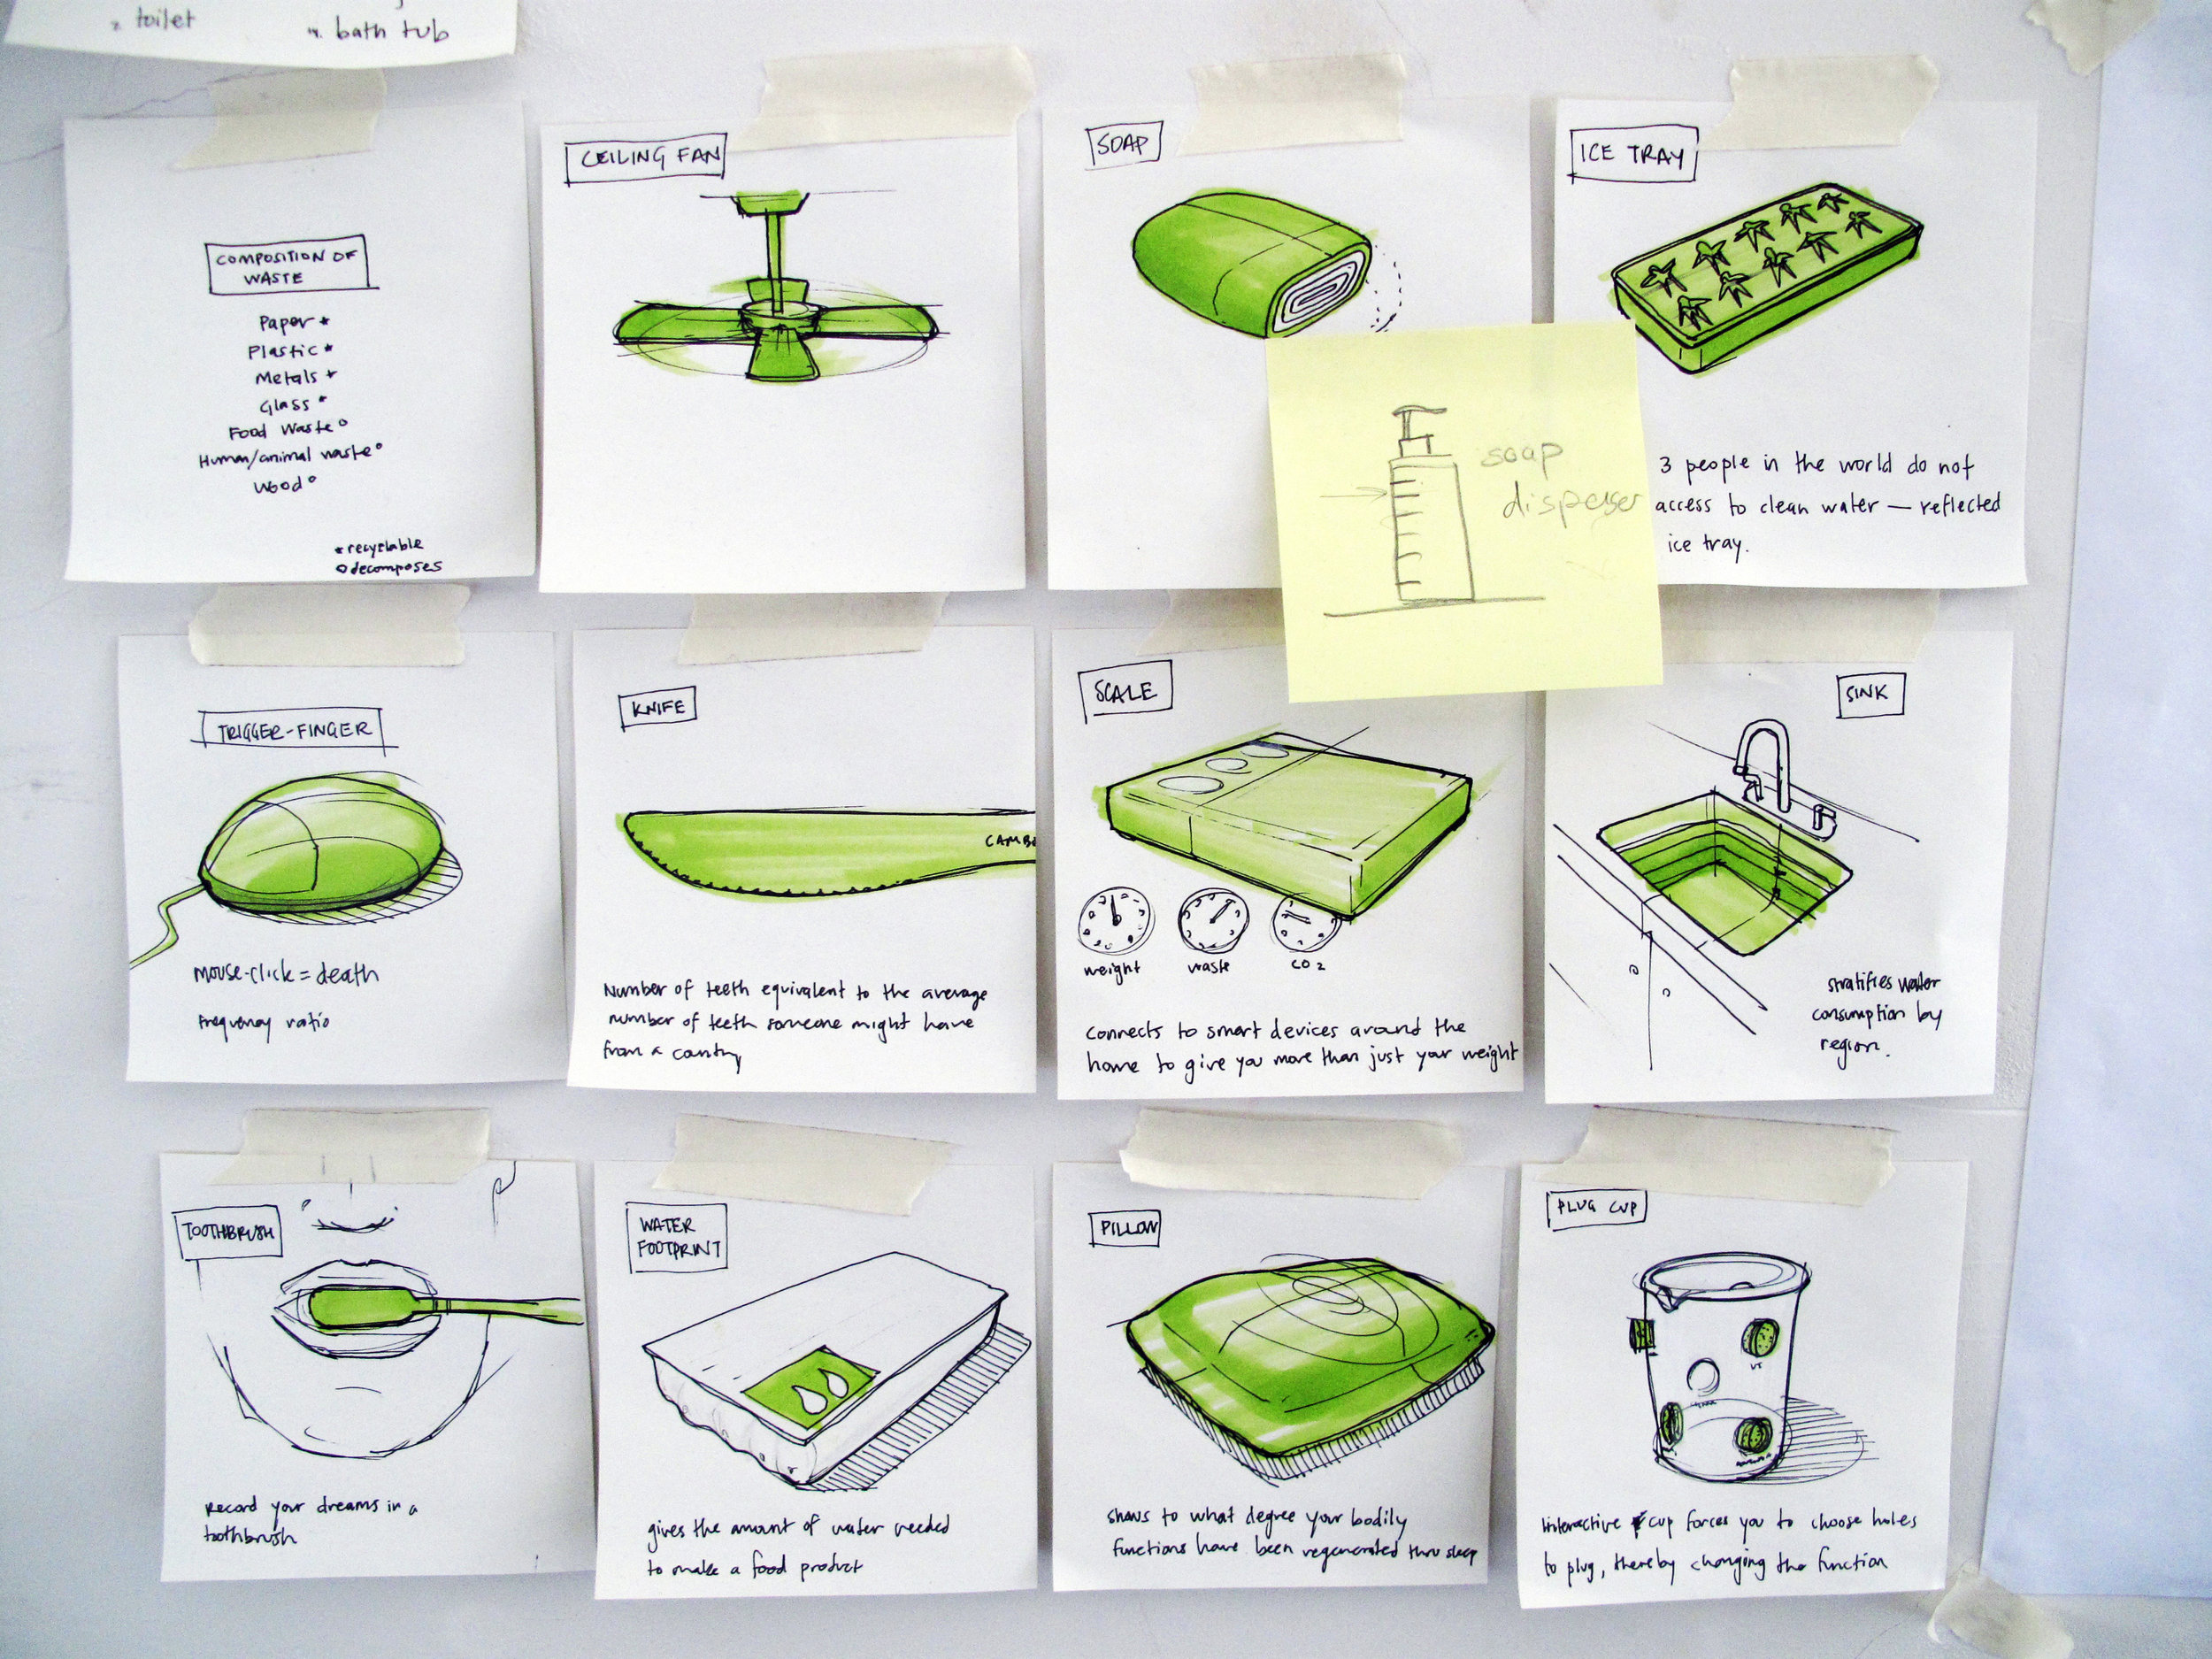
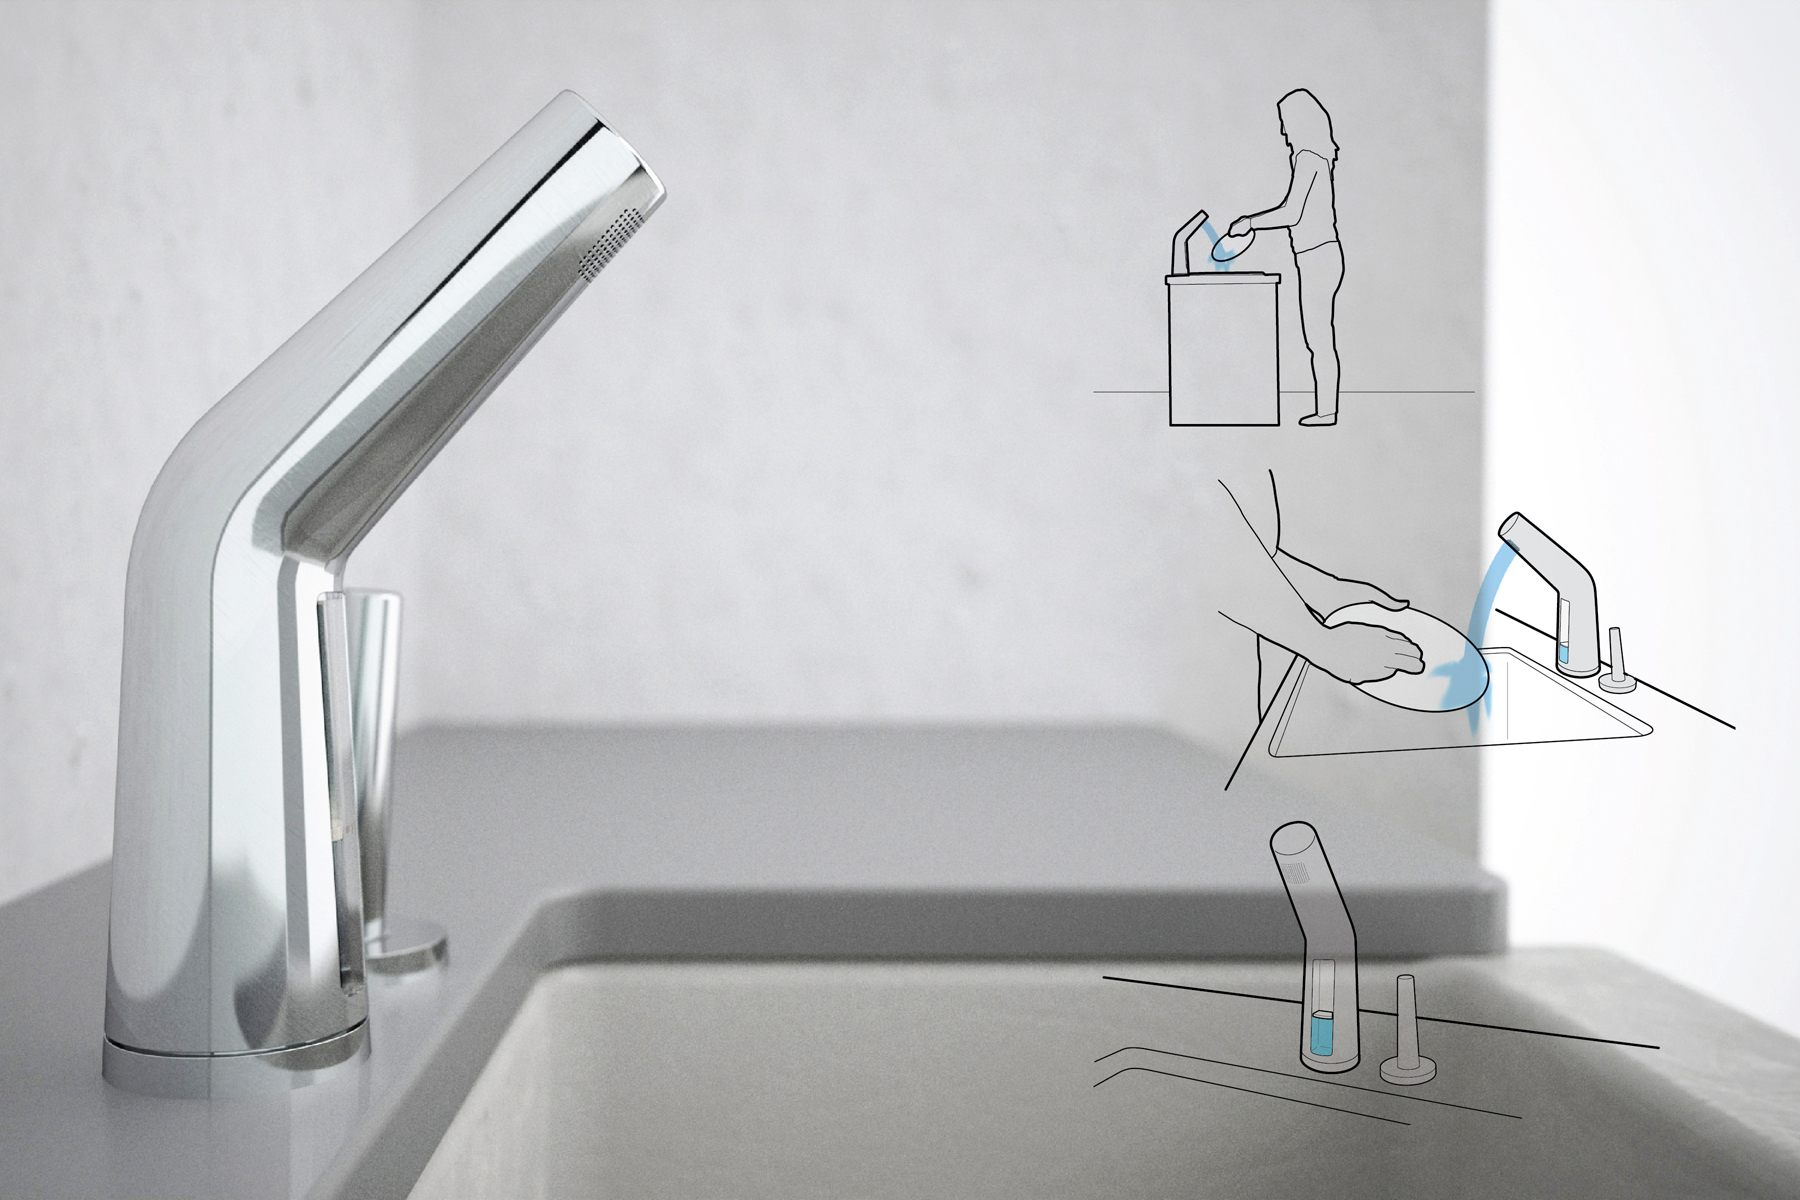
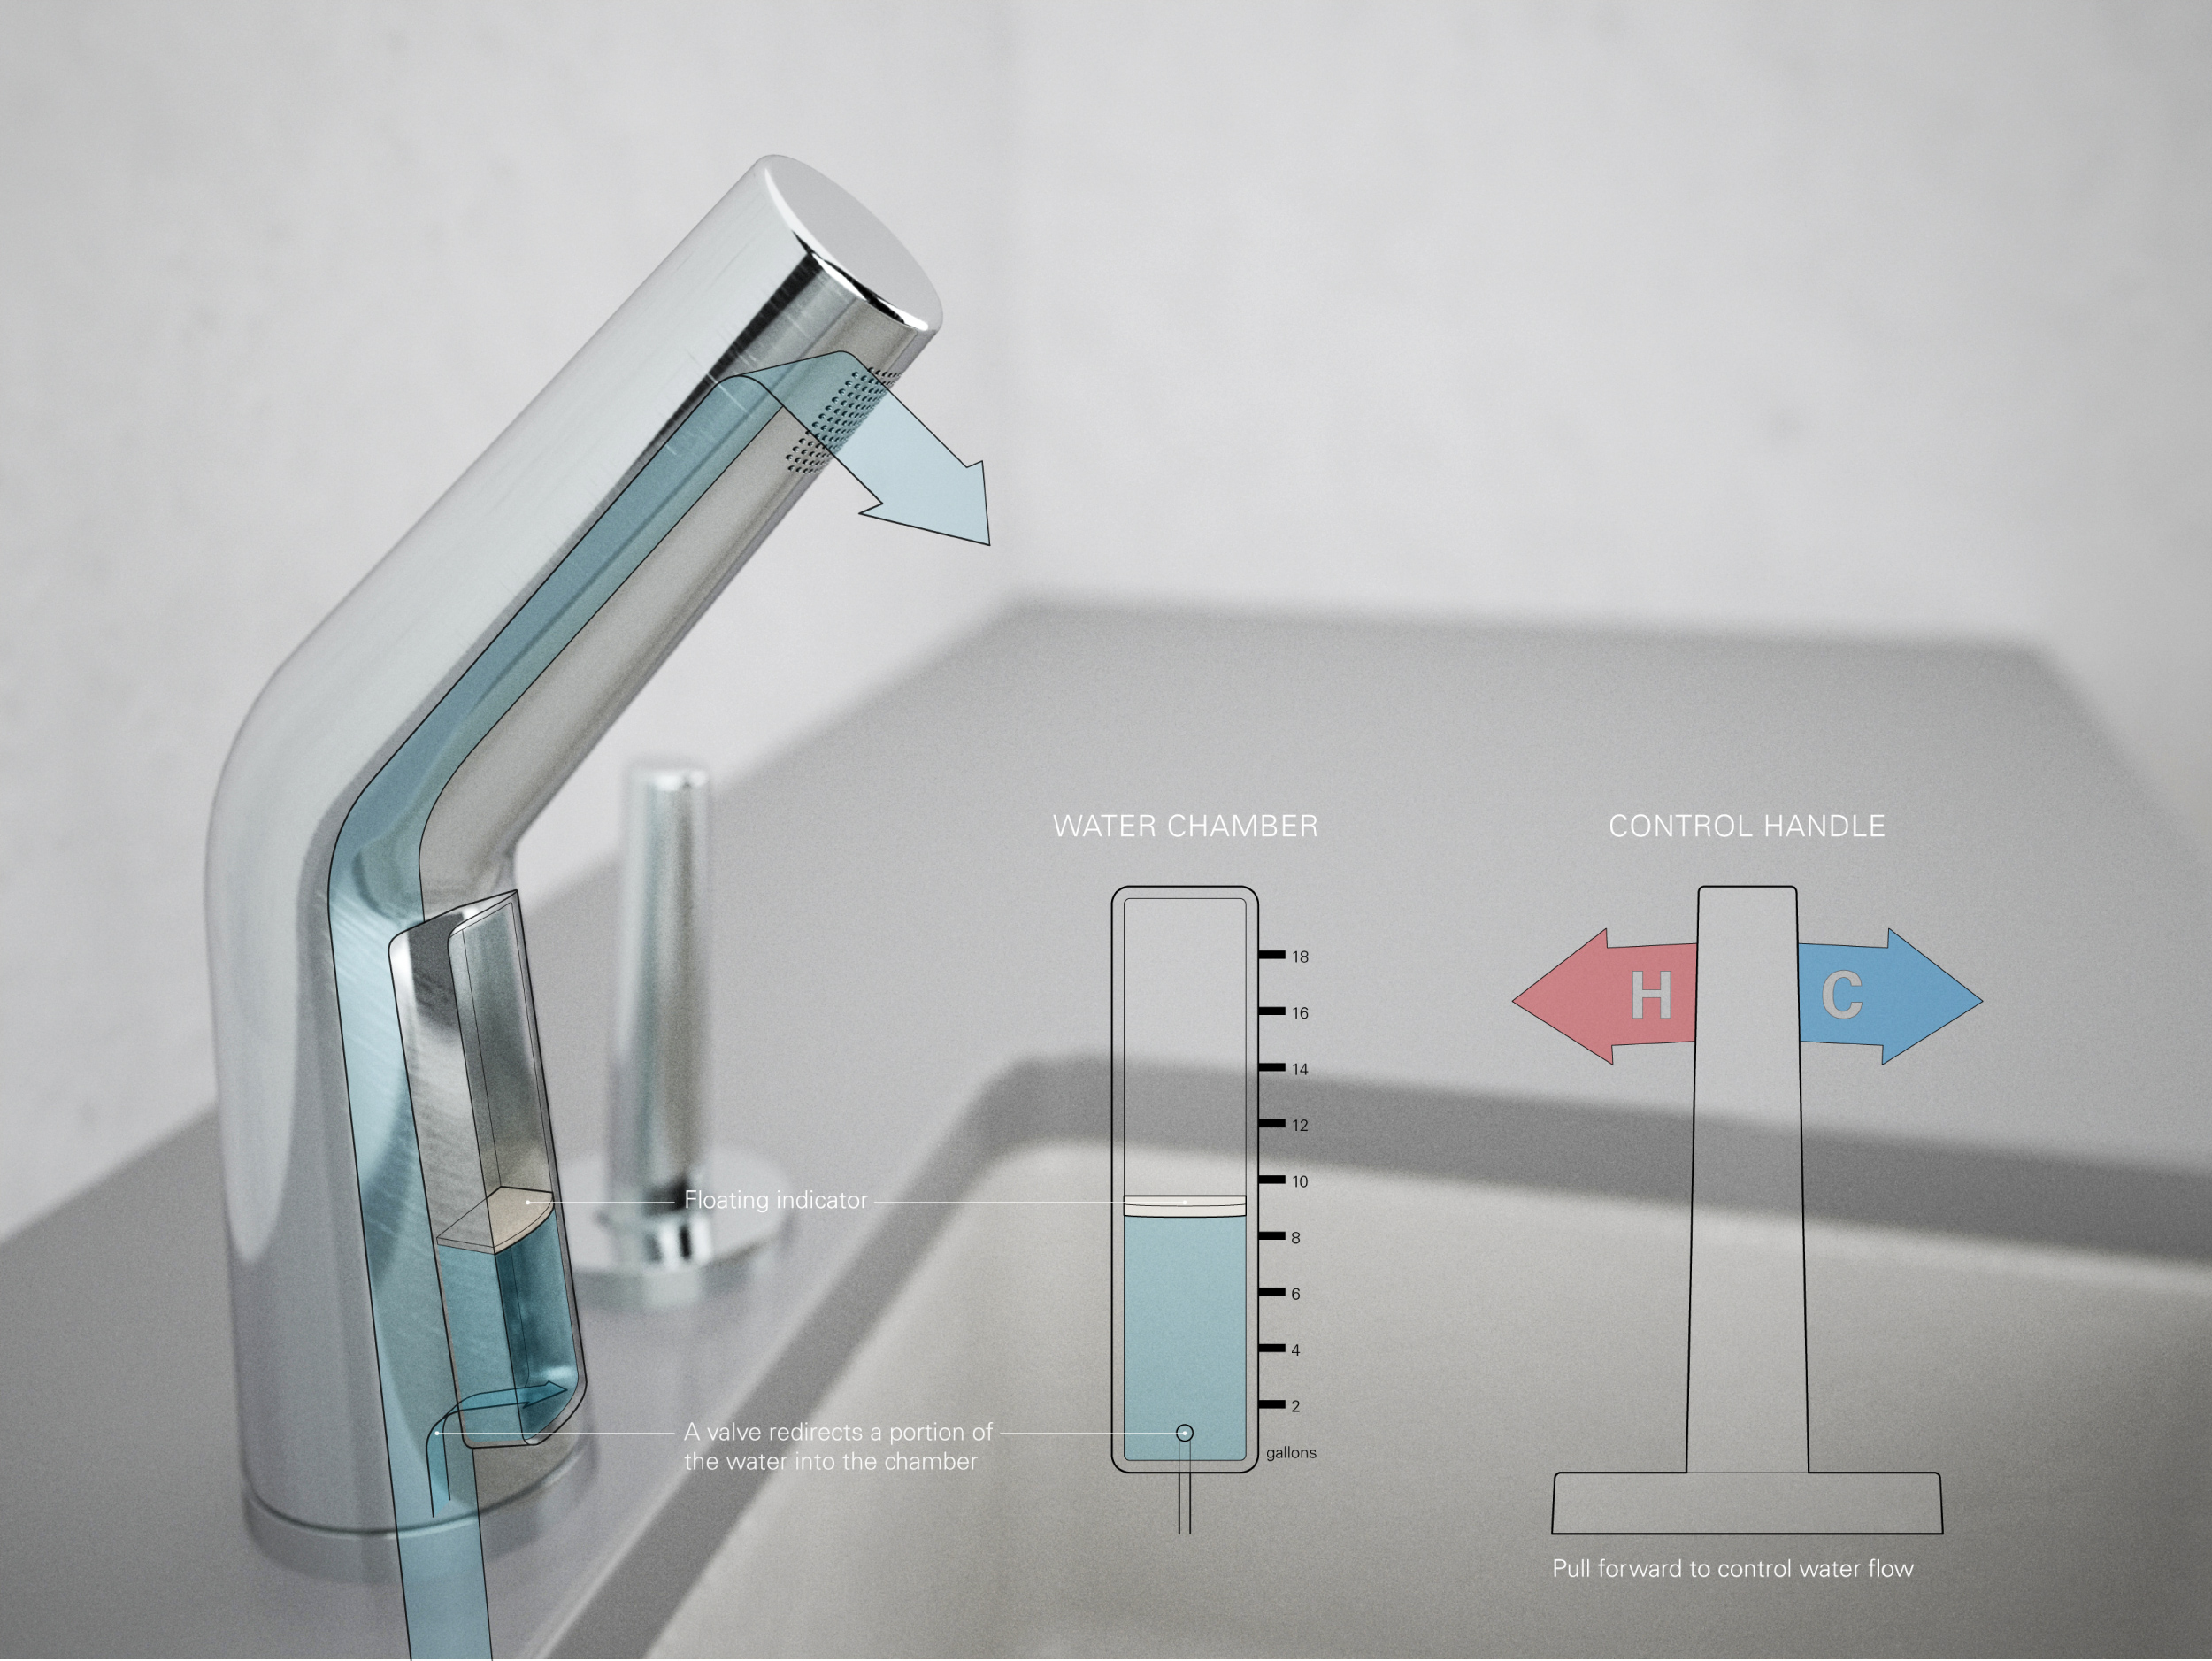
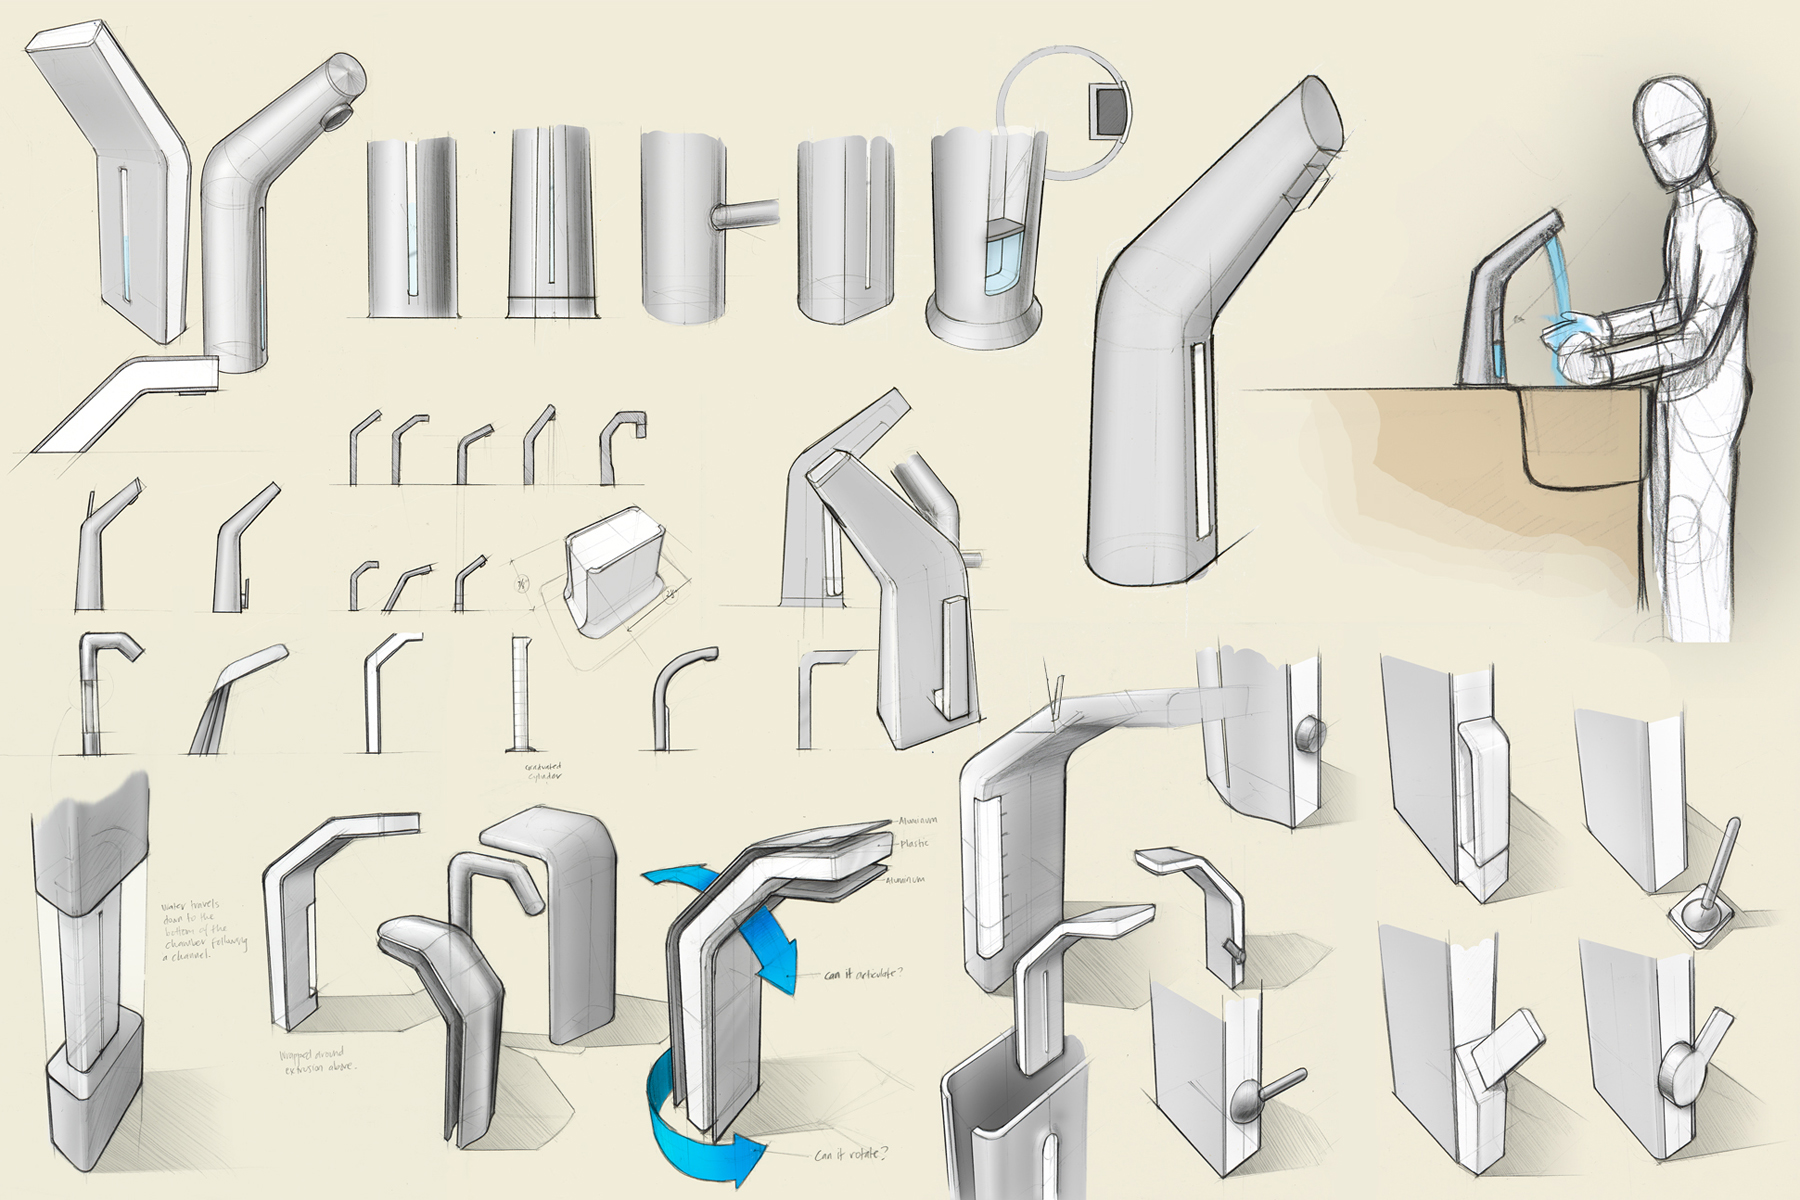
This faucet visualizes the amount of water consumed each time the faucet is used. As water flows out, a small portion of the water gets redirected through a valve into the faucet's glass chamber, showing the person how much water they are currently using.
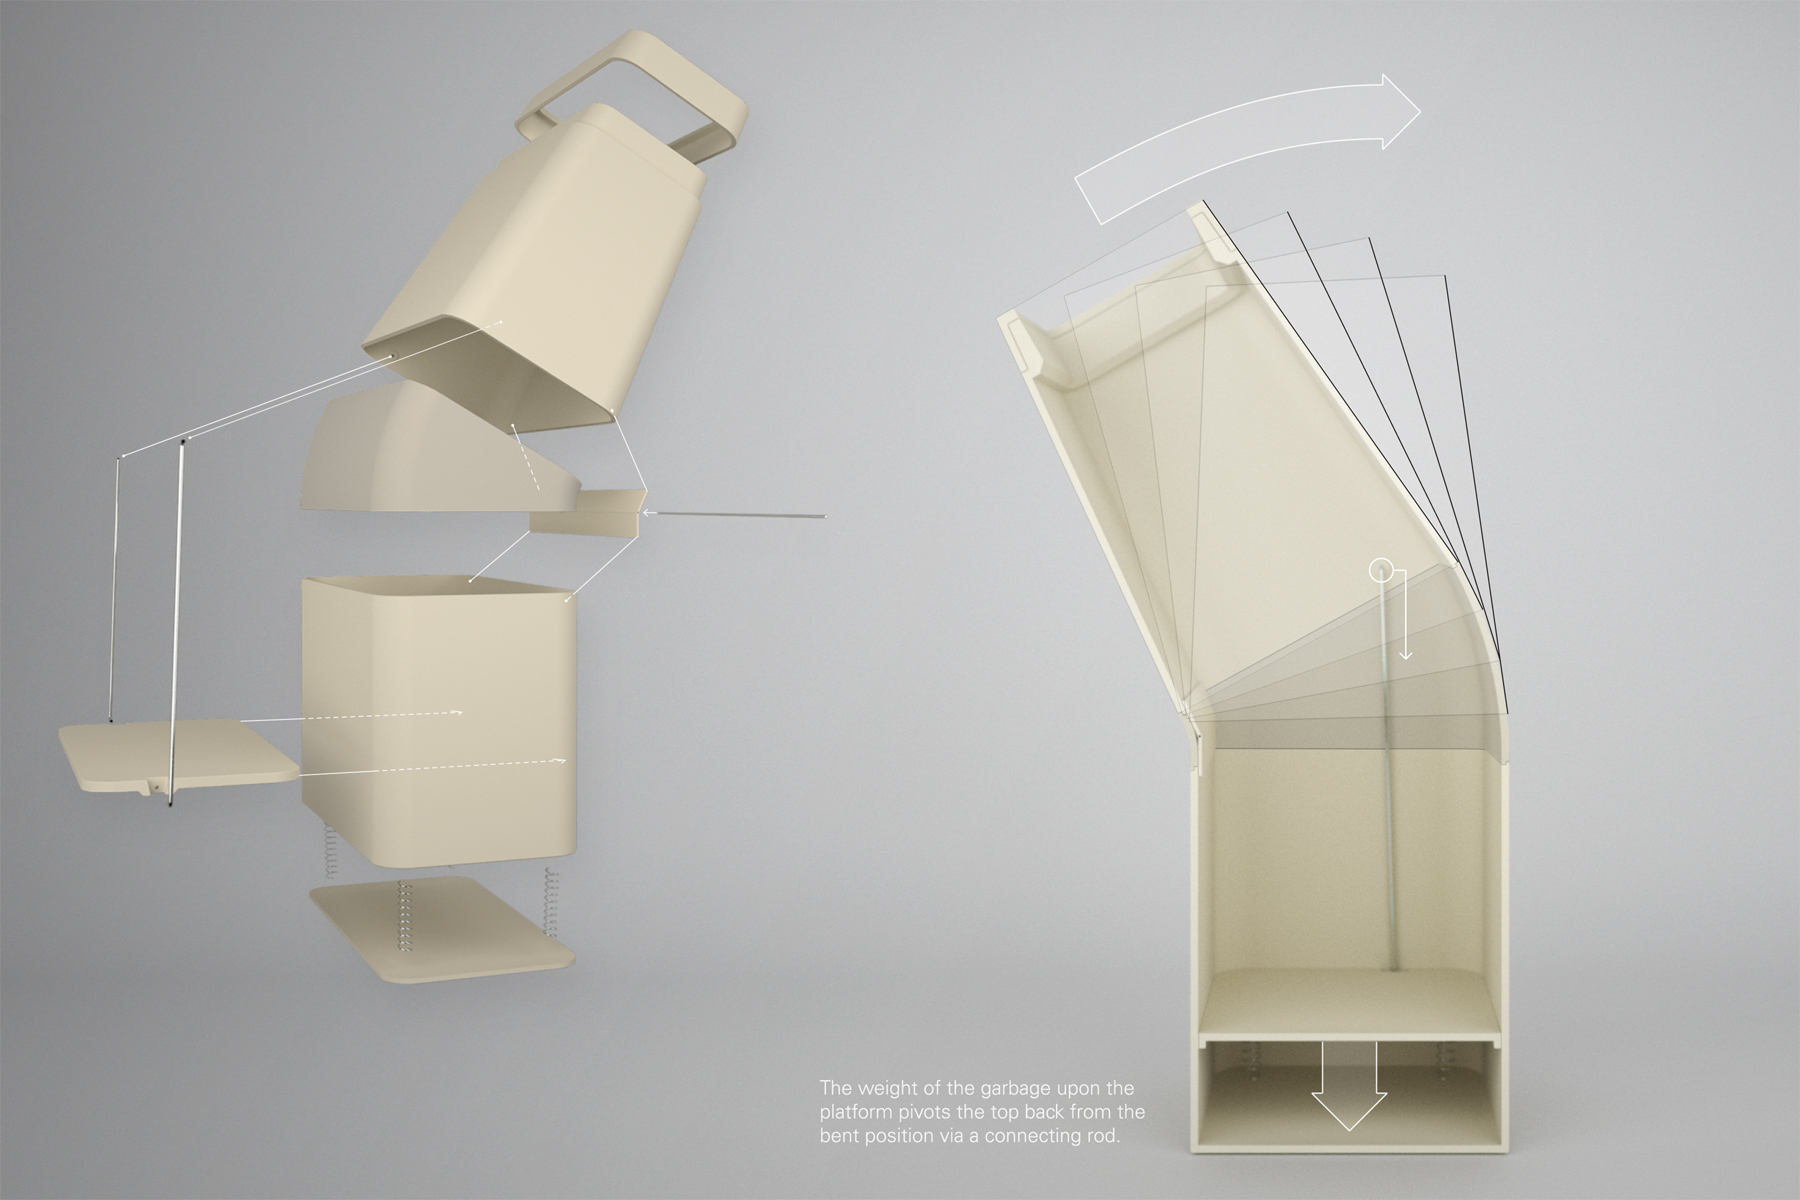
Waste Production
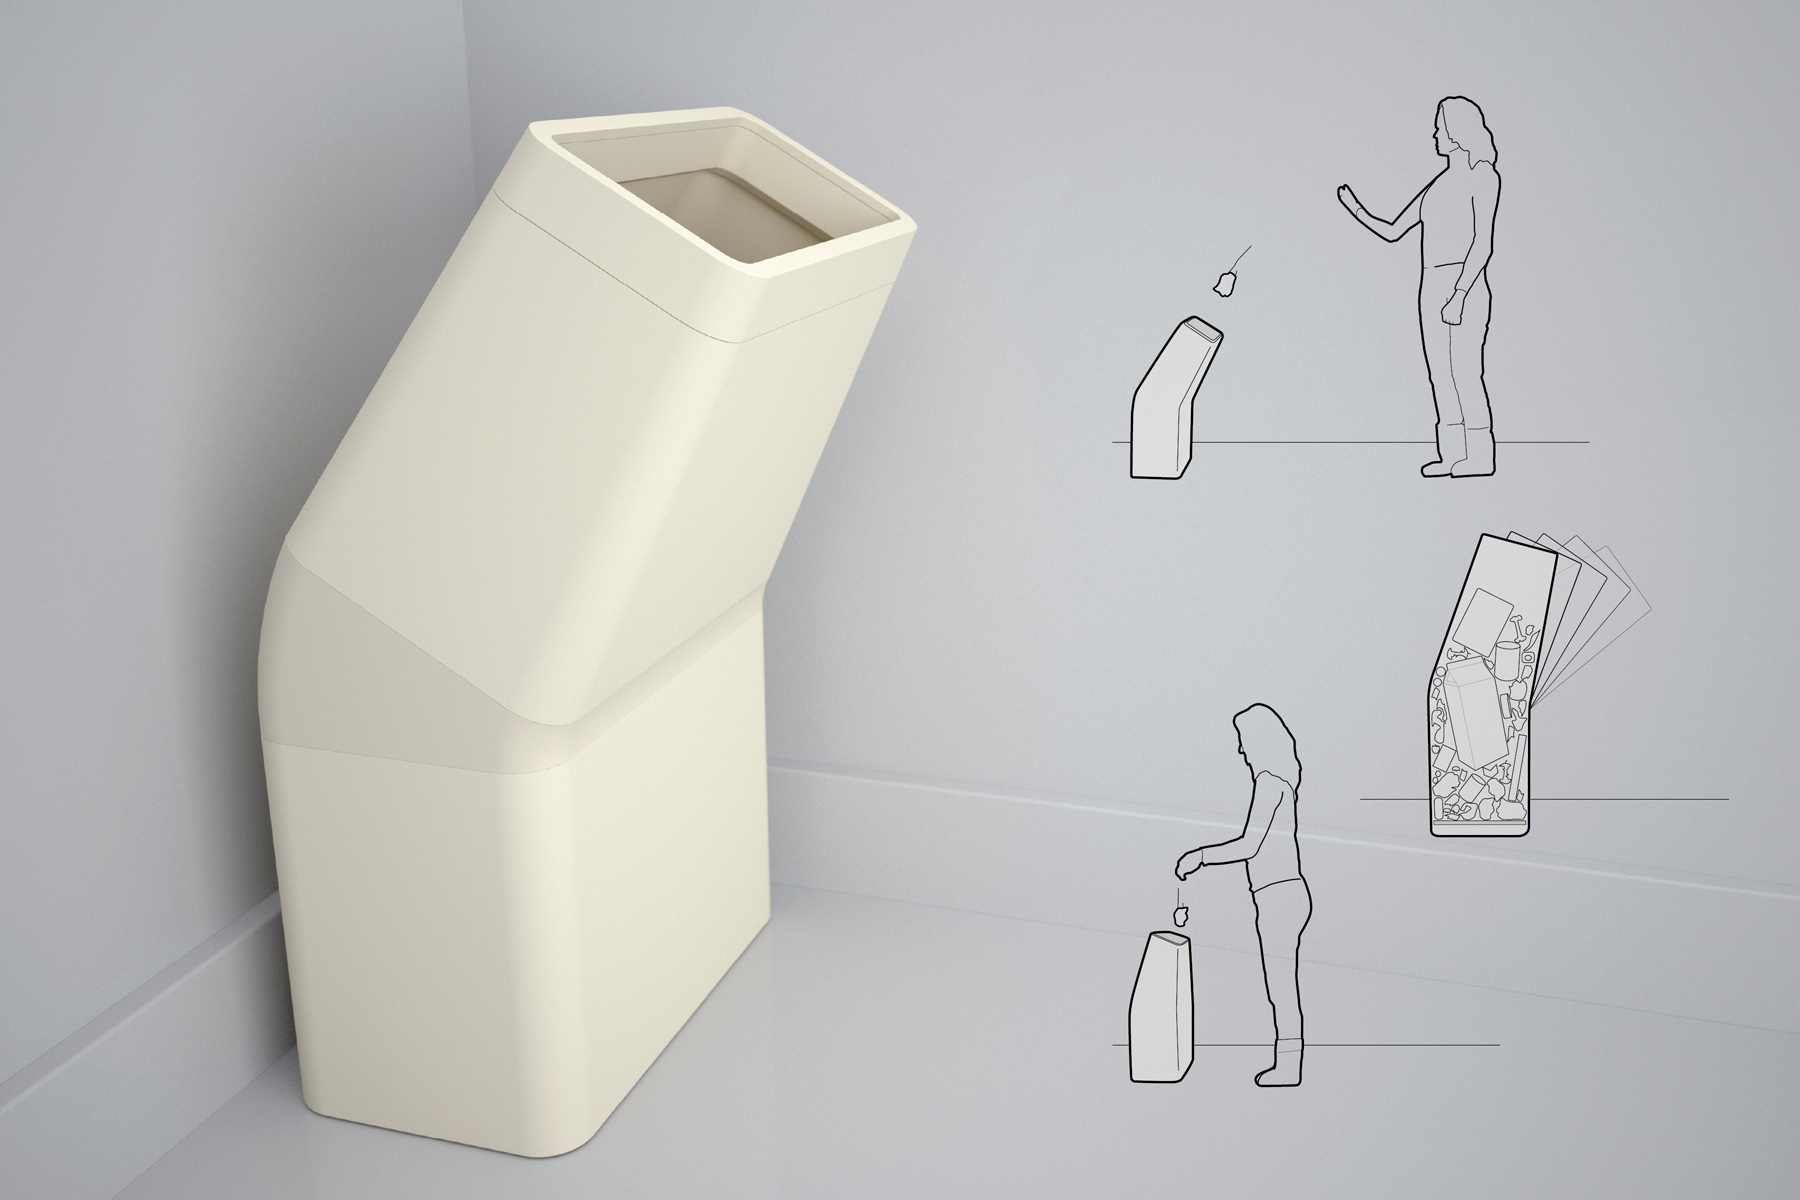
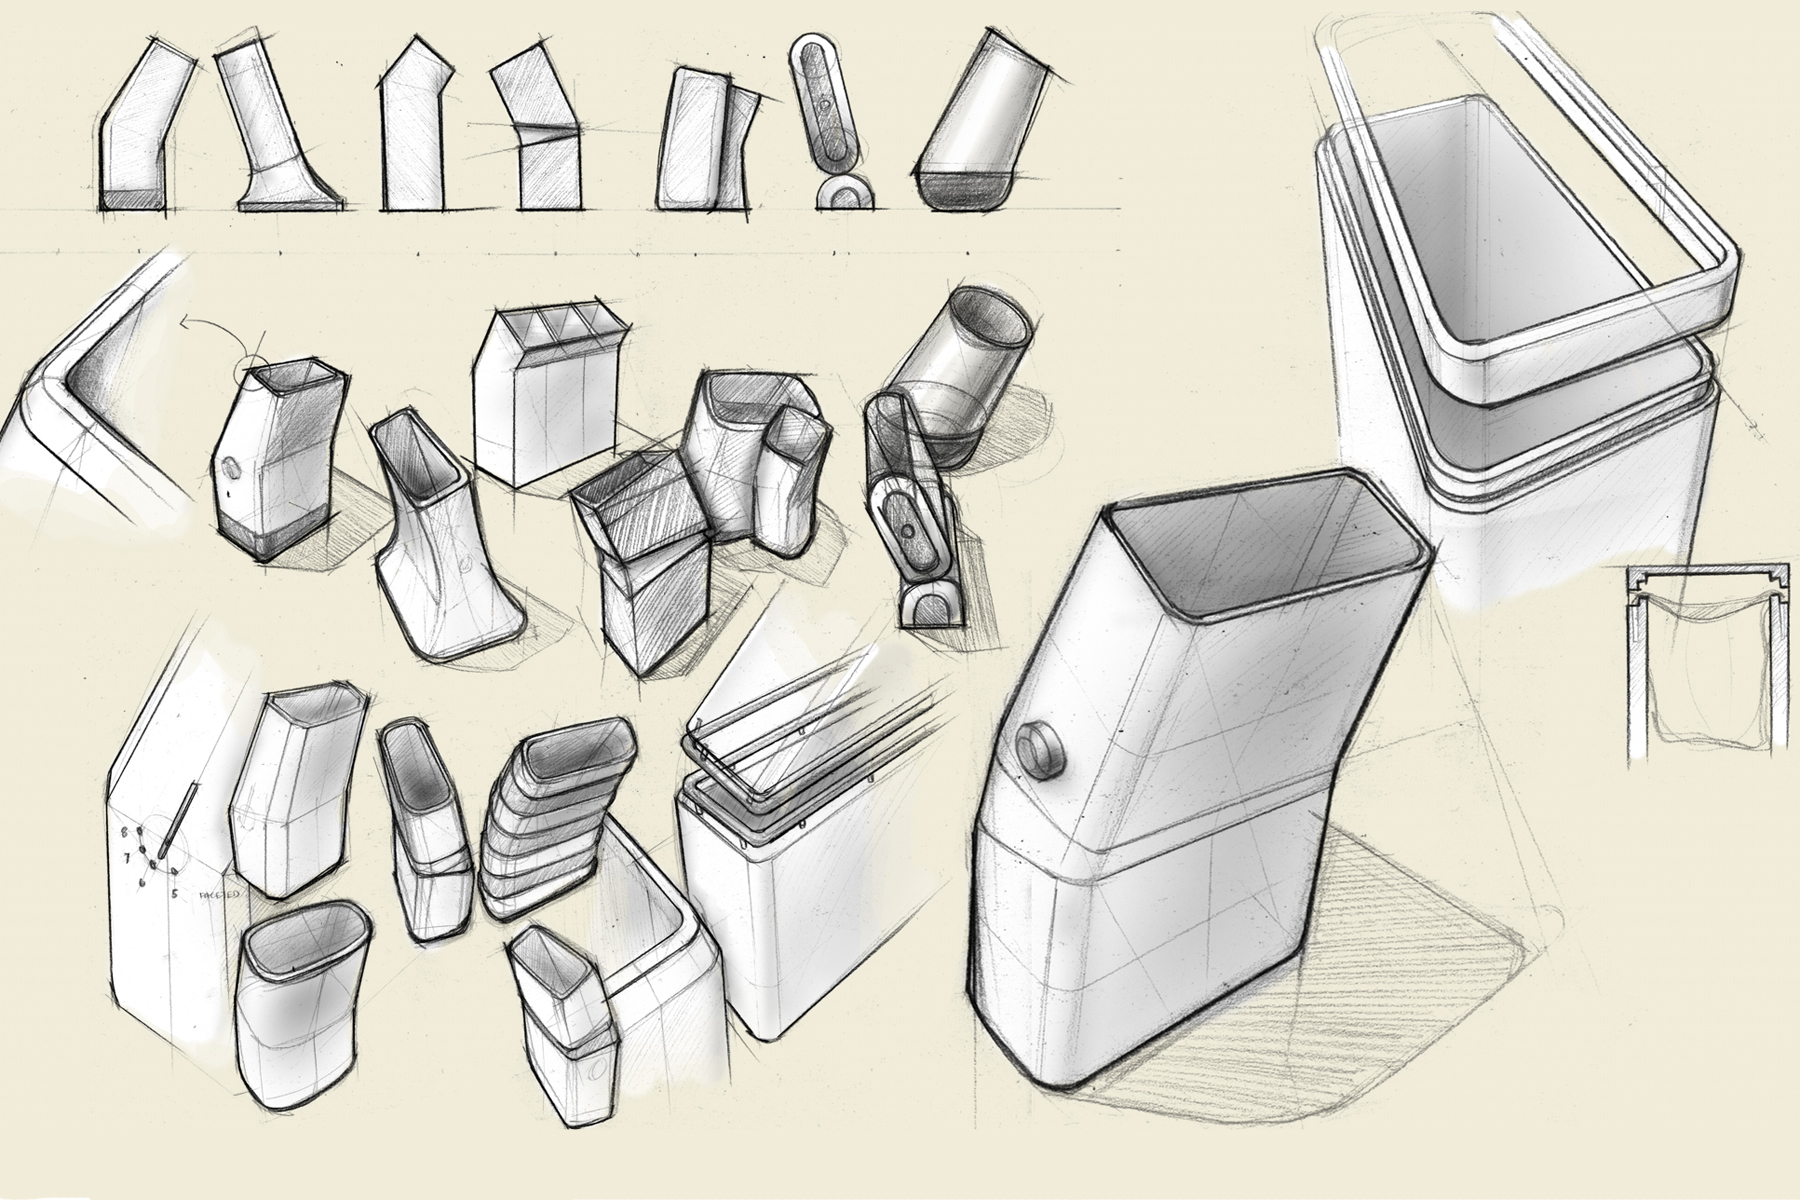
This waste bin visualizes household waste. The weight of the garbage changes the angle of the waste bin, making it less inviting and giving you a visual cue as to how much trash you are throwing away.

