
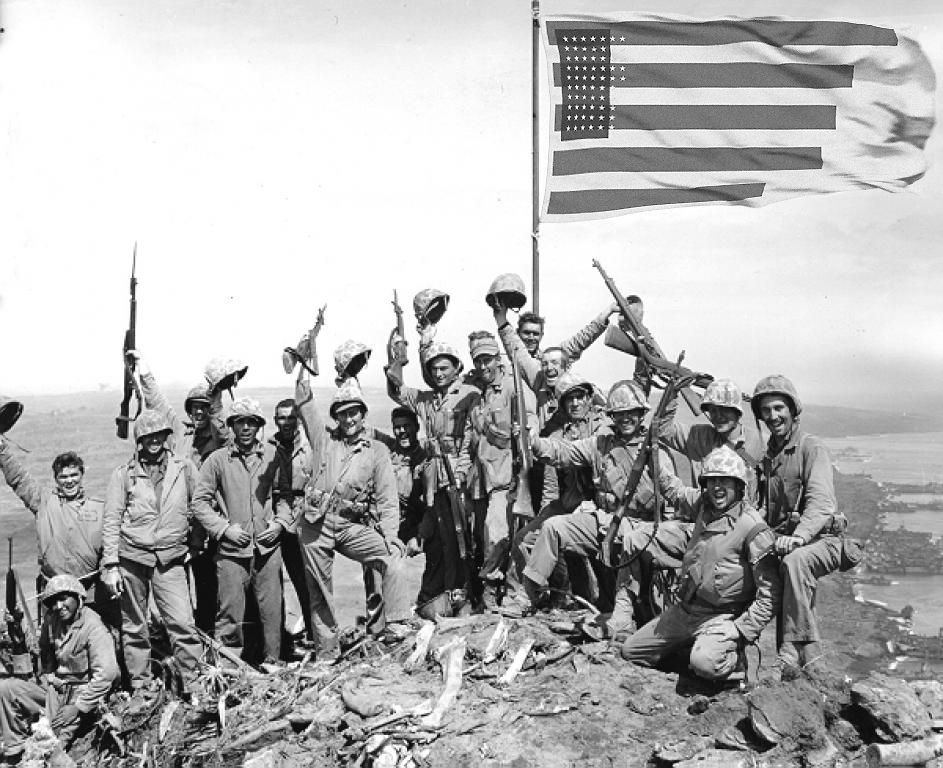
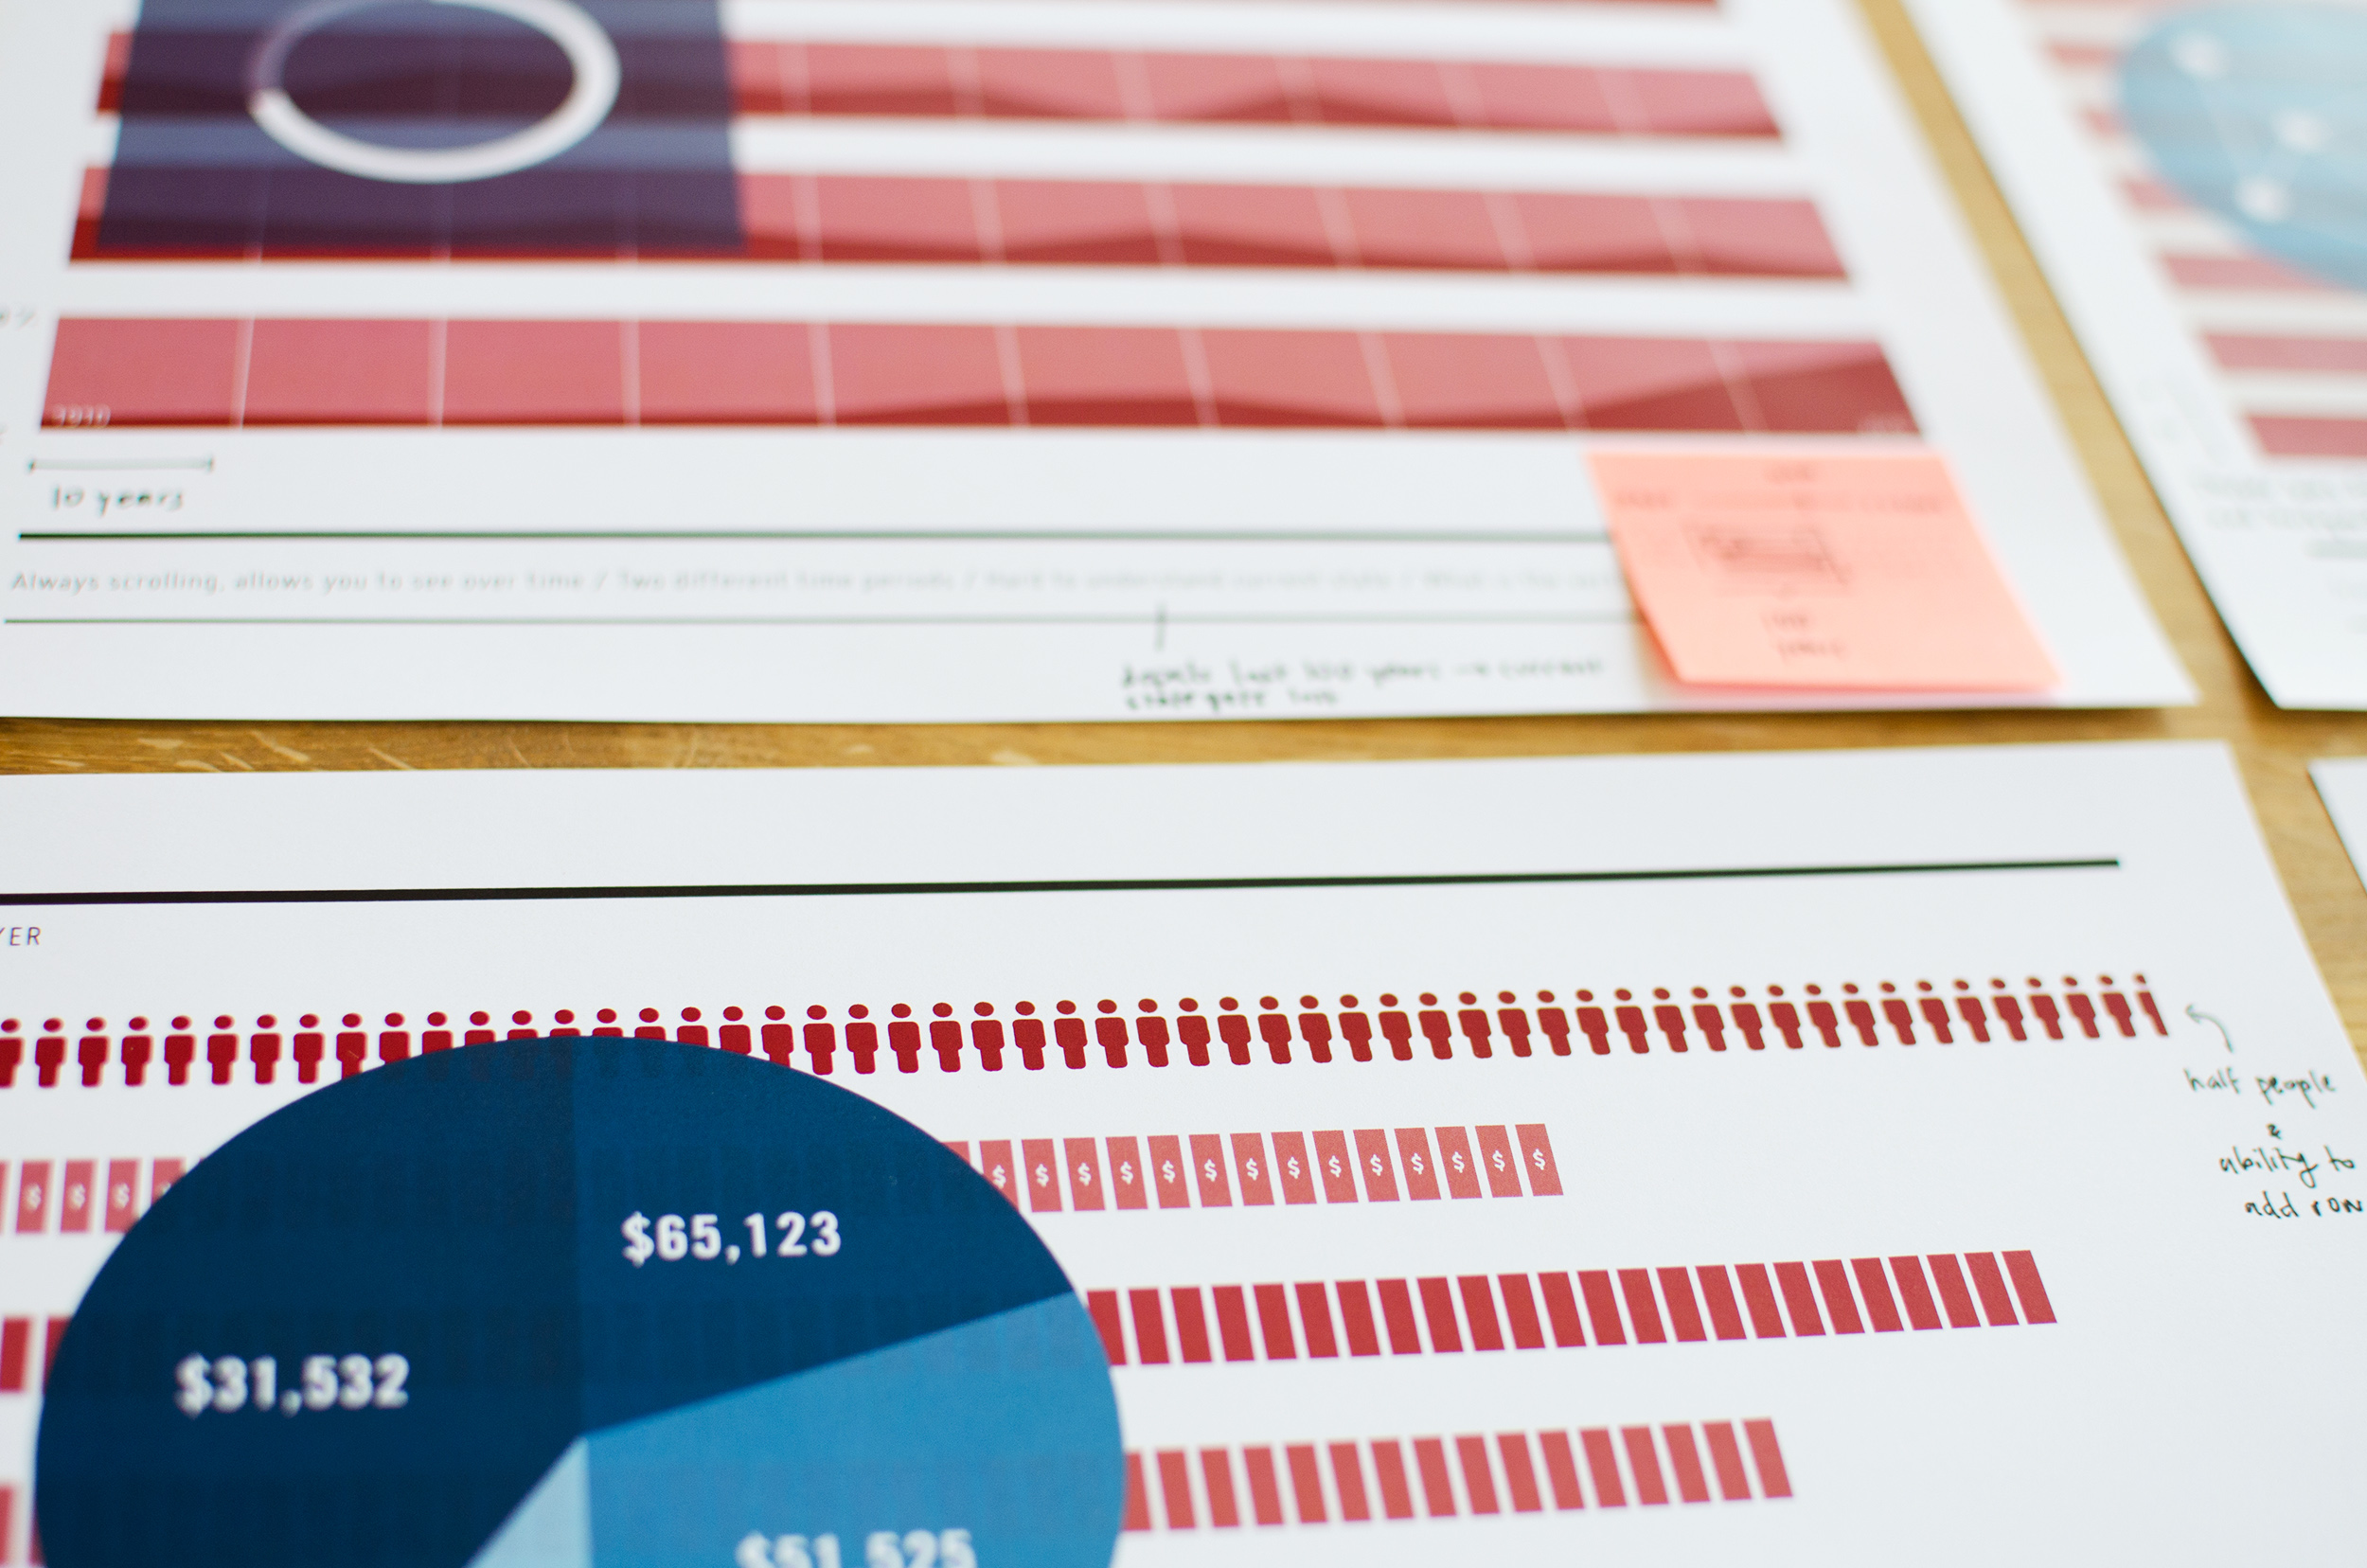
Scroll horizontally to see the flags from 1890–2013. Click to see the data behind the visualization.
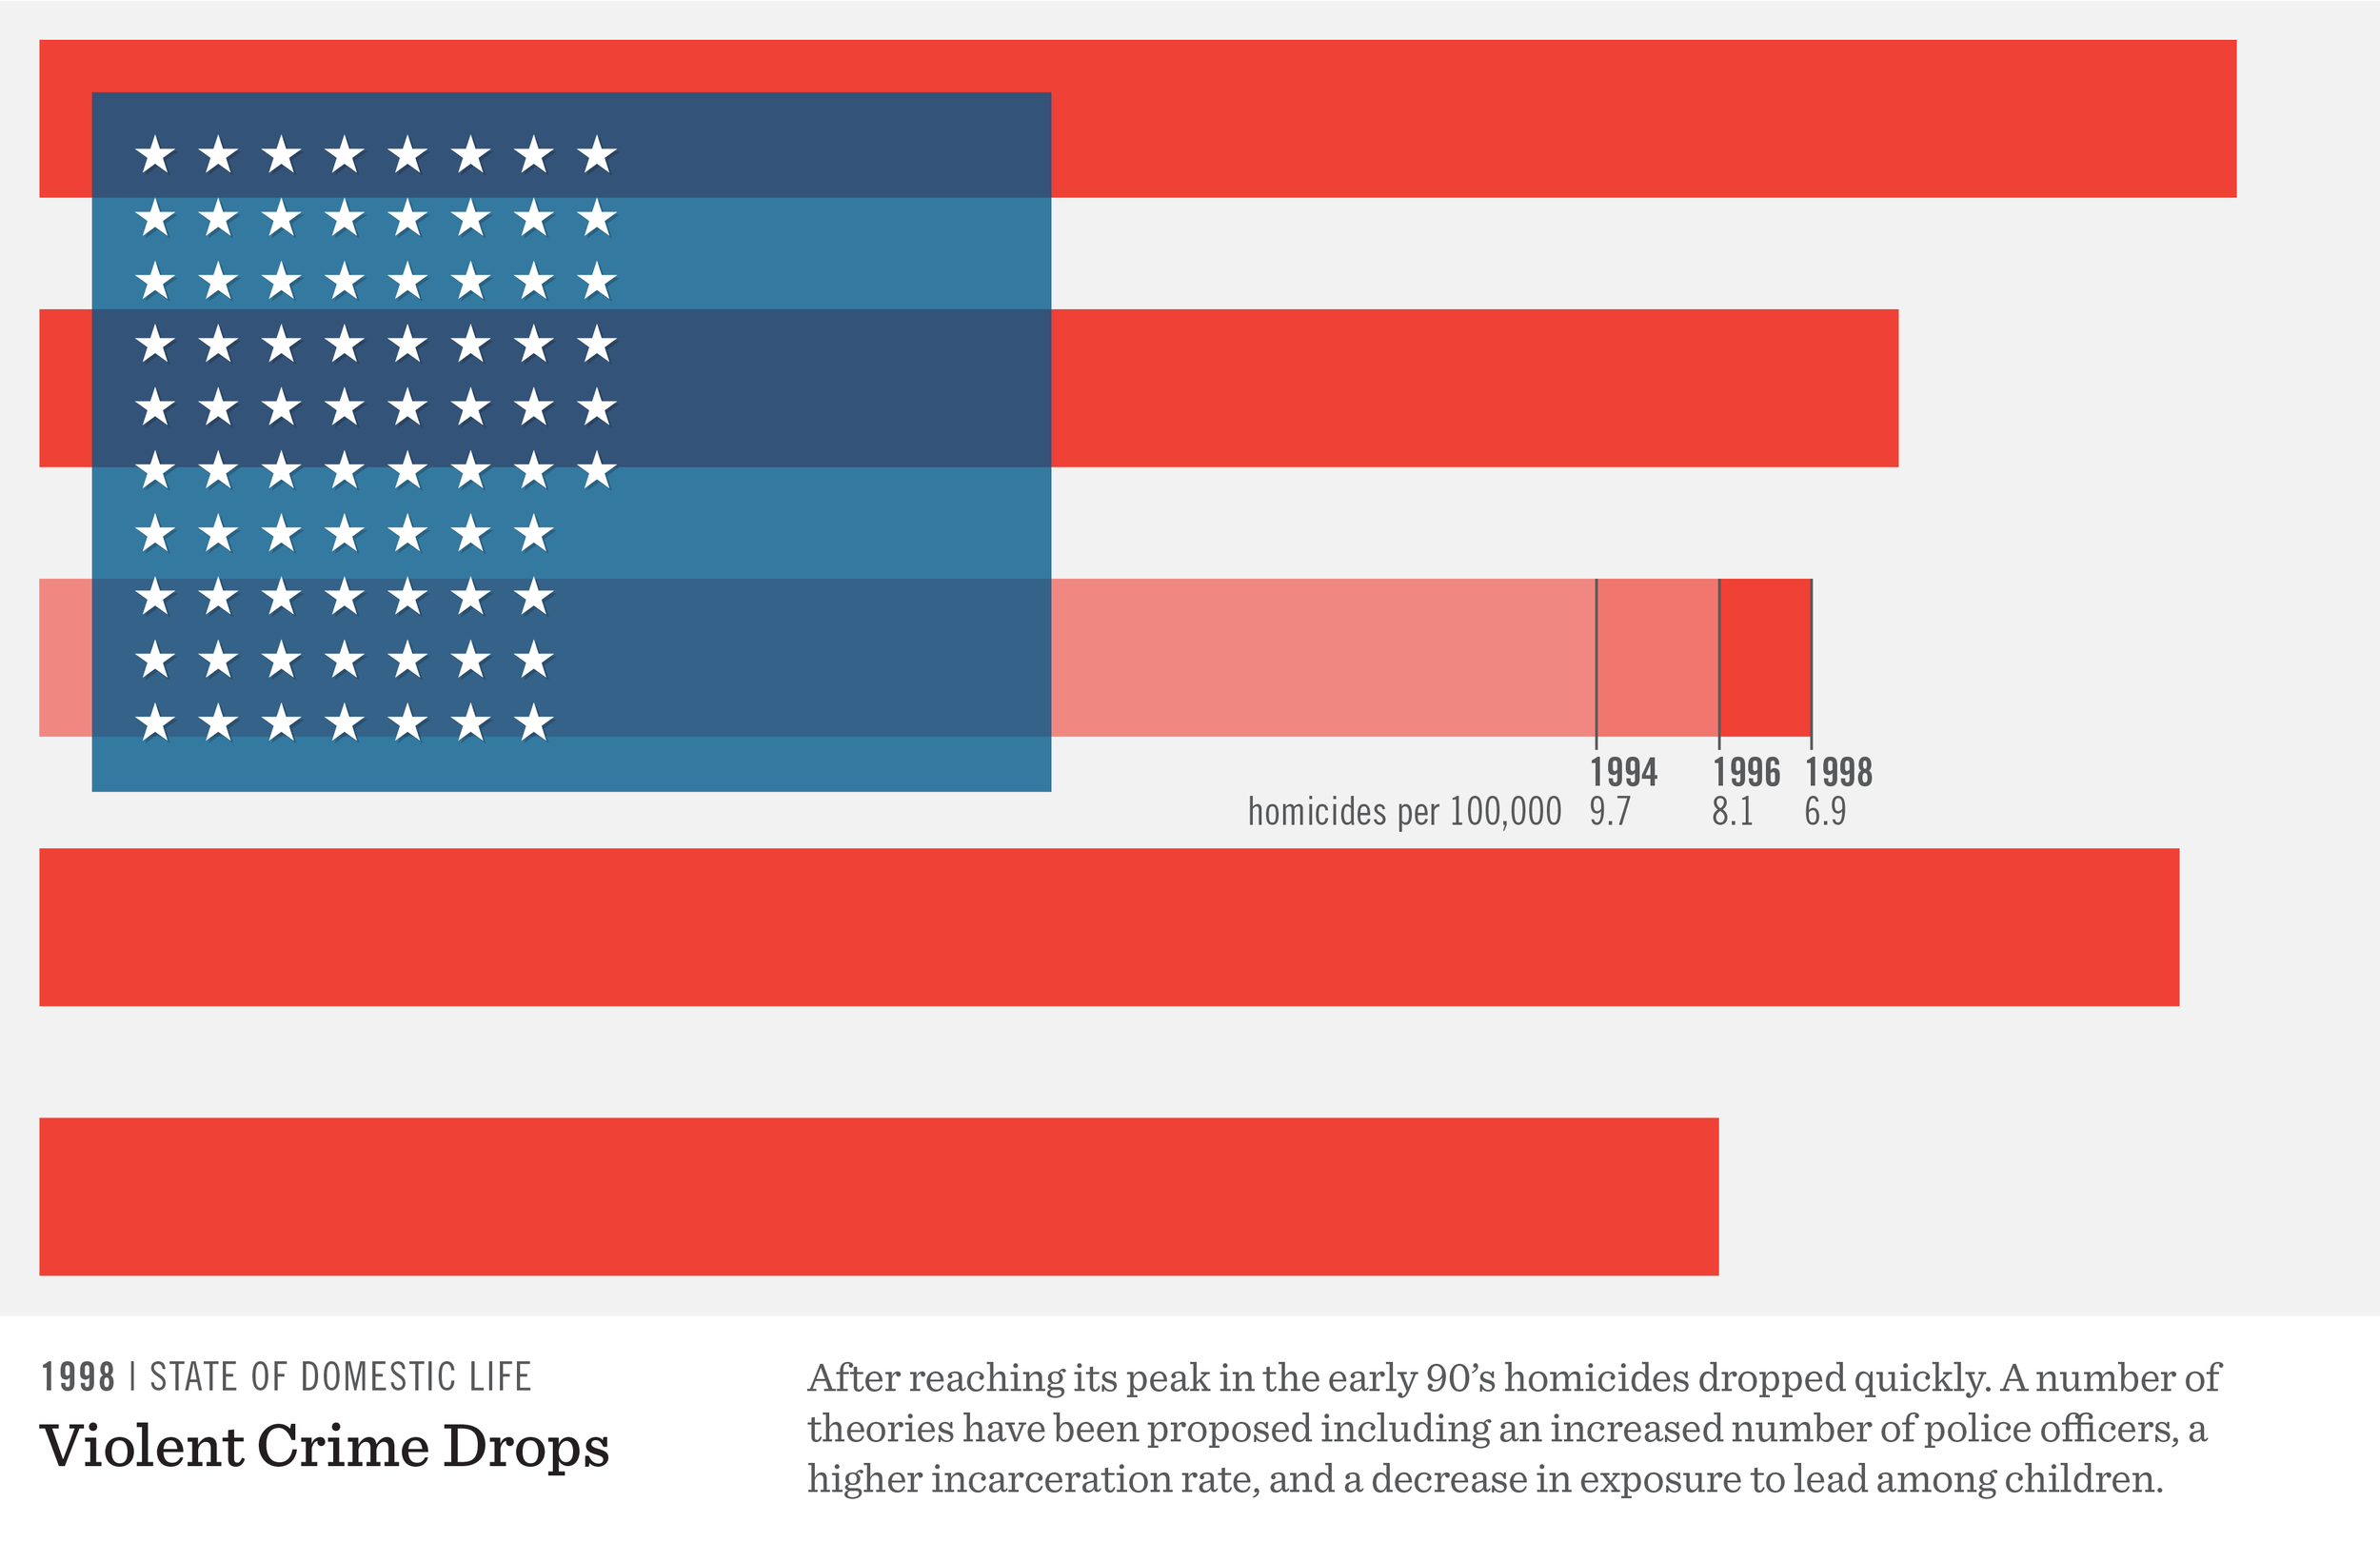
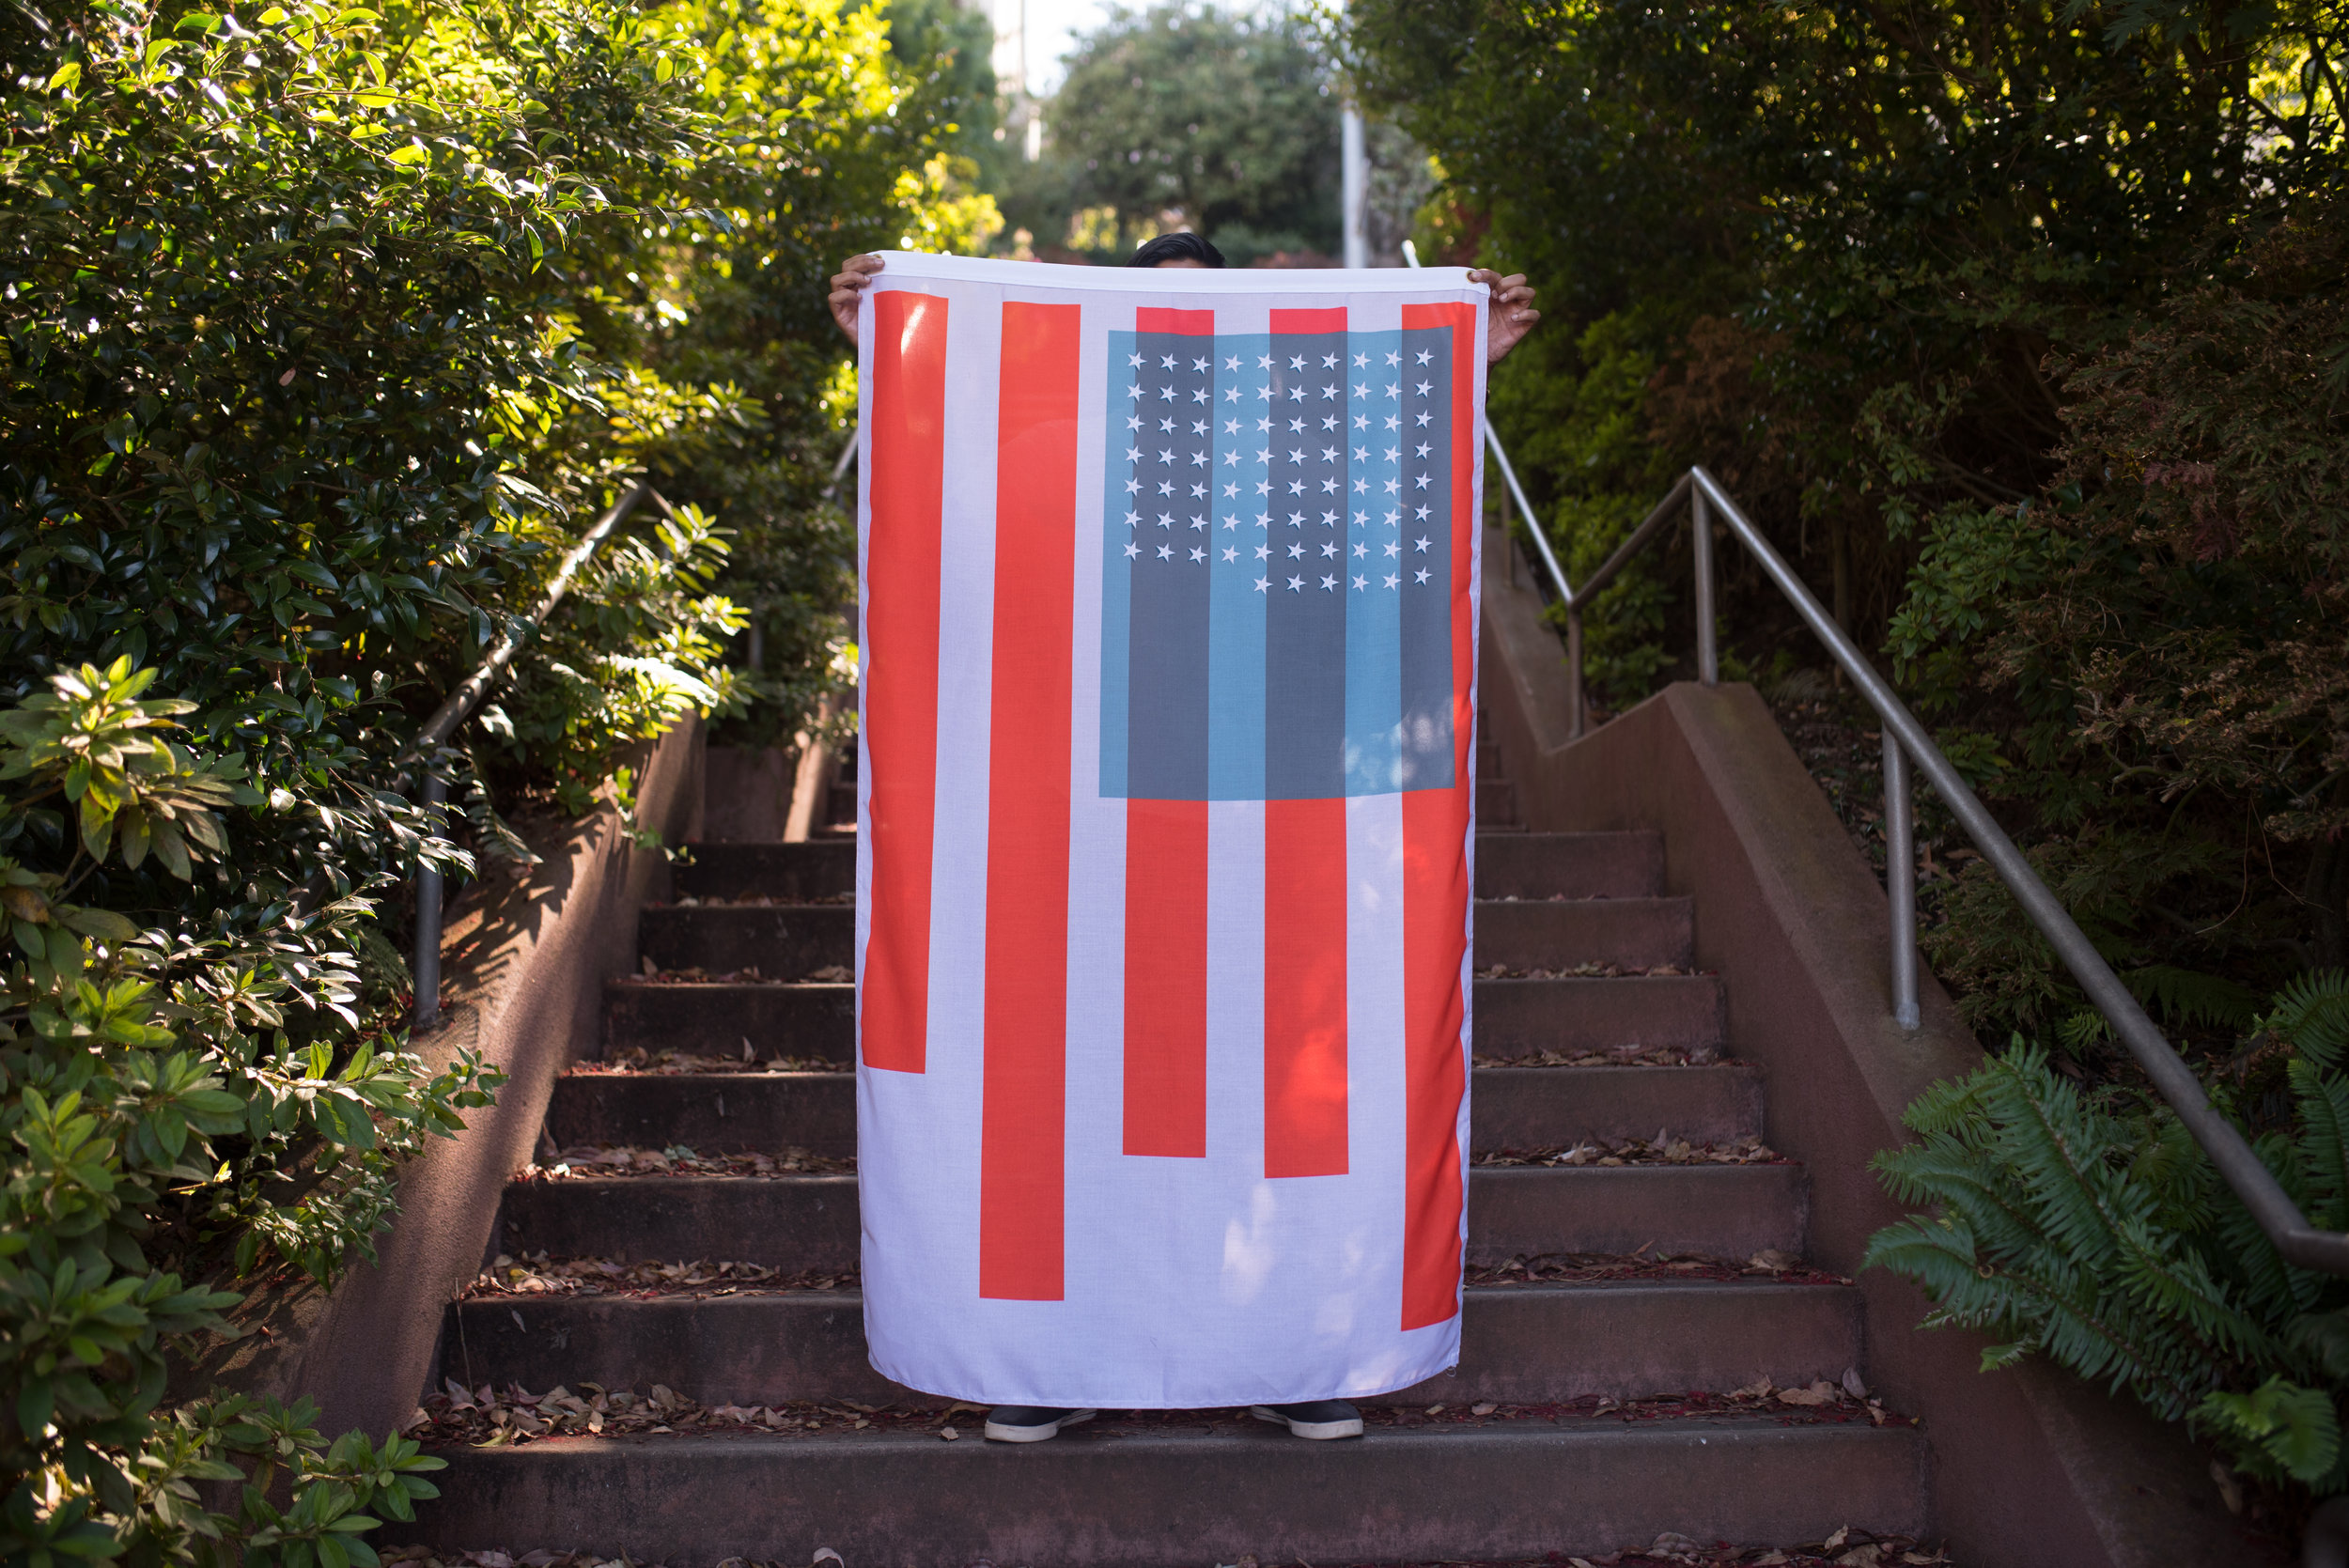
State of the Union takes a set of metrics and visually transforms elements on the flag to represent their current state1. Over years or decades, citizens would be able to perceive shifts in the country as we get wealthier, healthier and live better lives—or not. In the case of the American flag here, meaning is driven by the condition of the citizens it represents rather than abstract notions of statehood or bygone colonies.
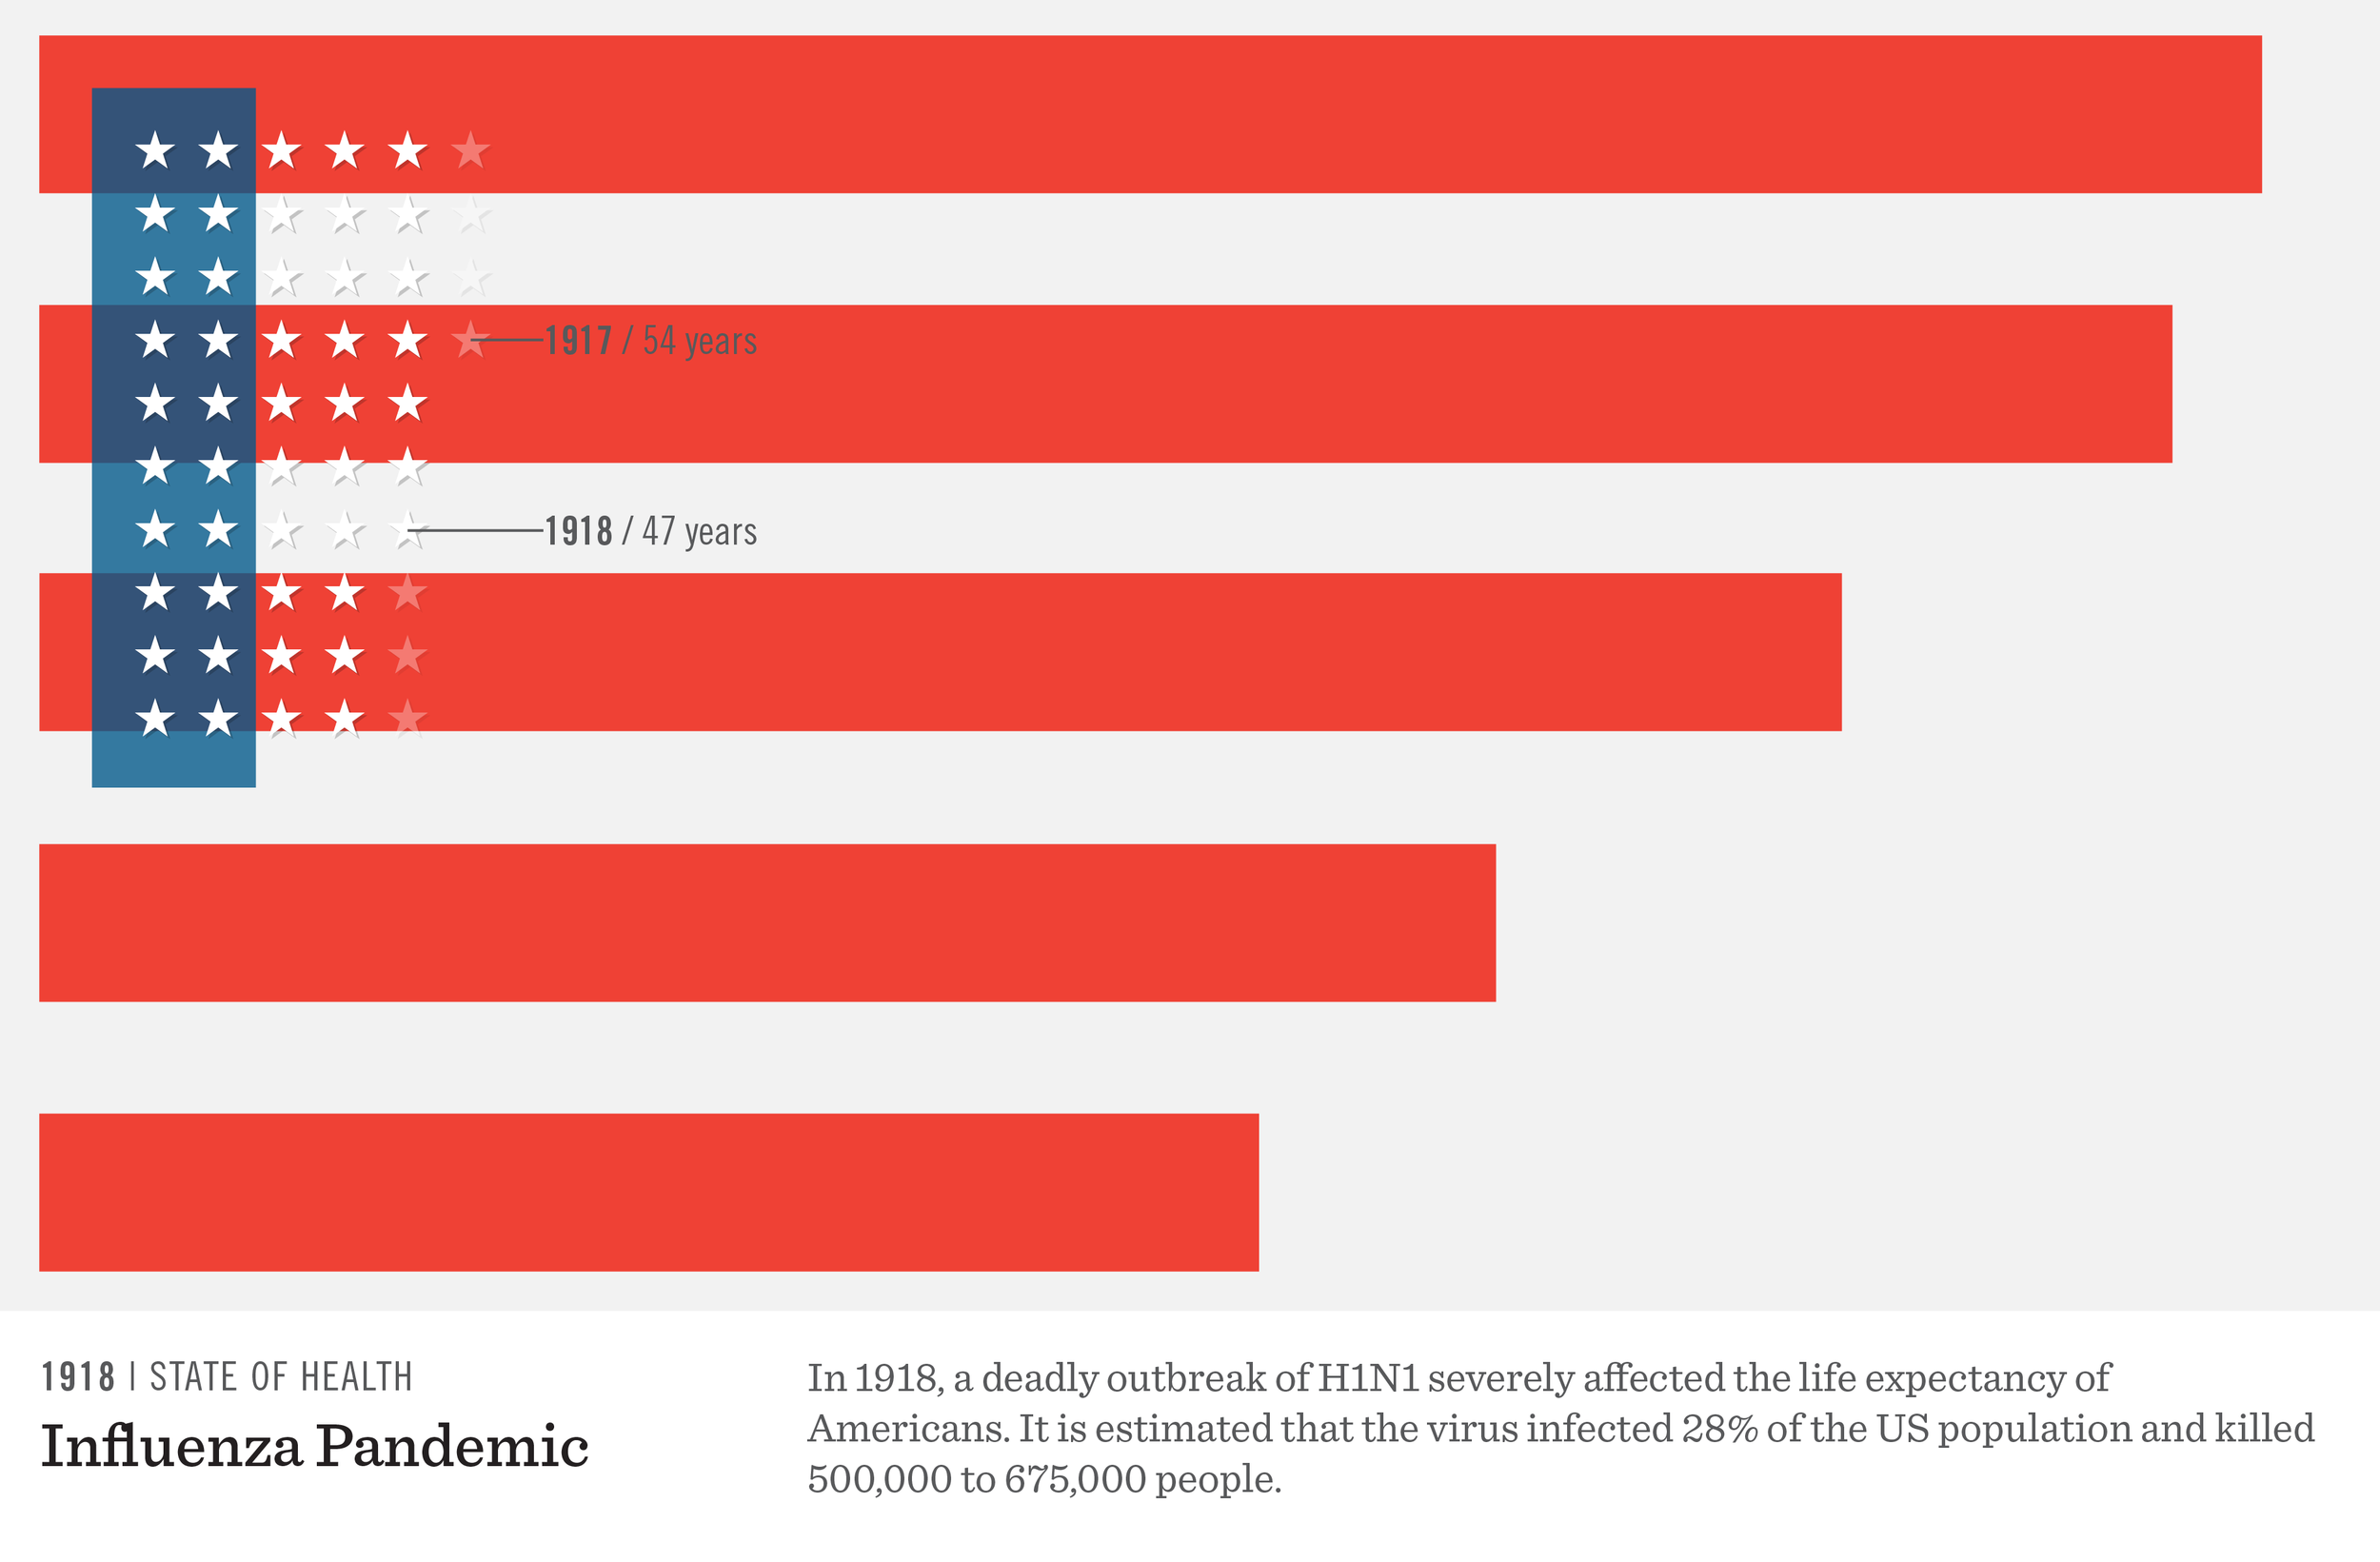
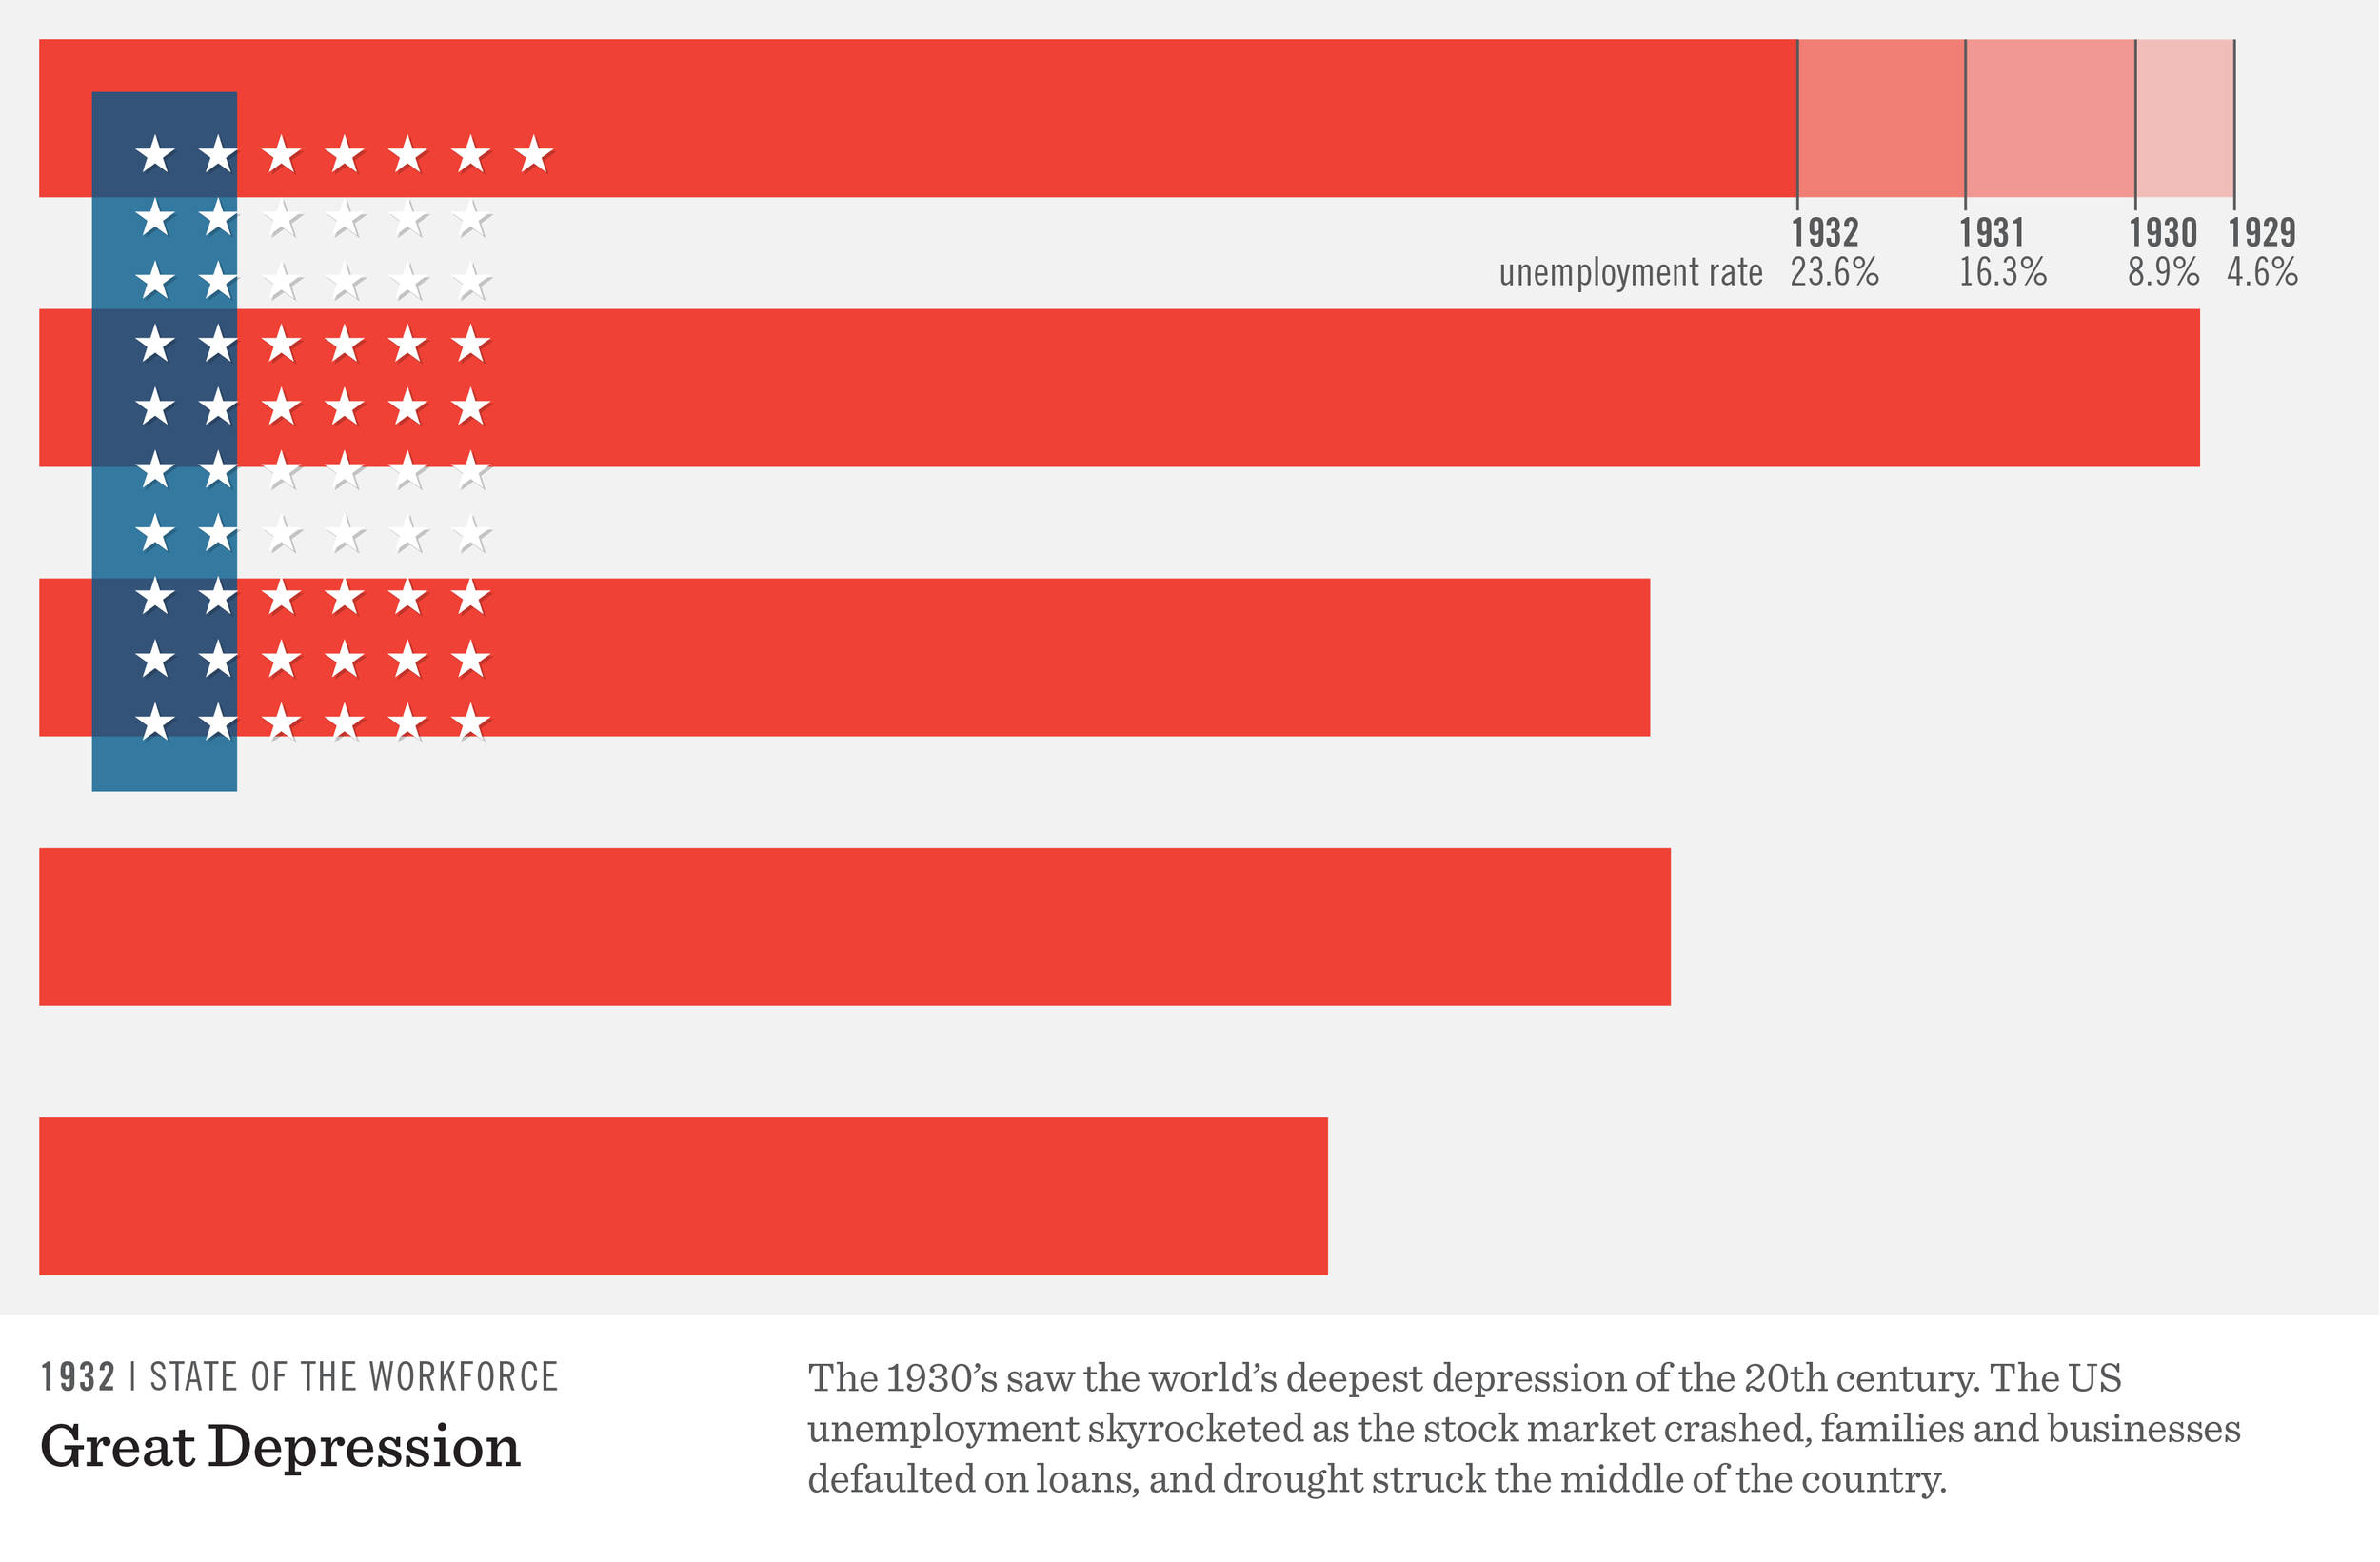
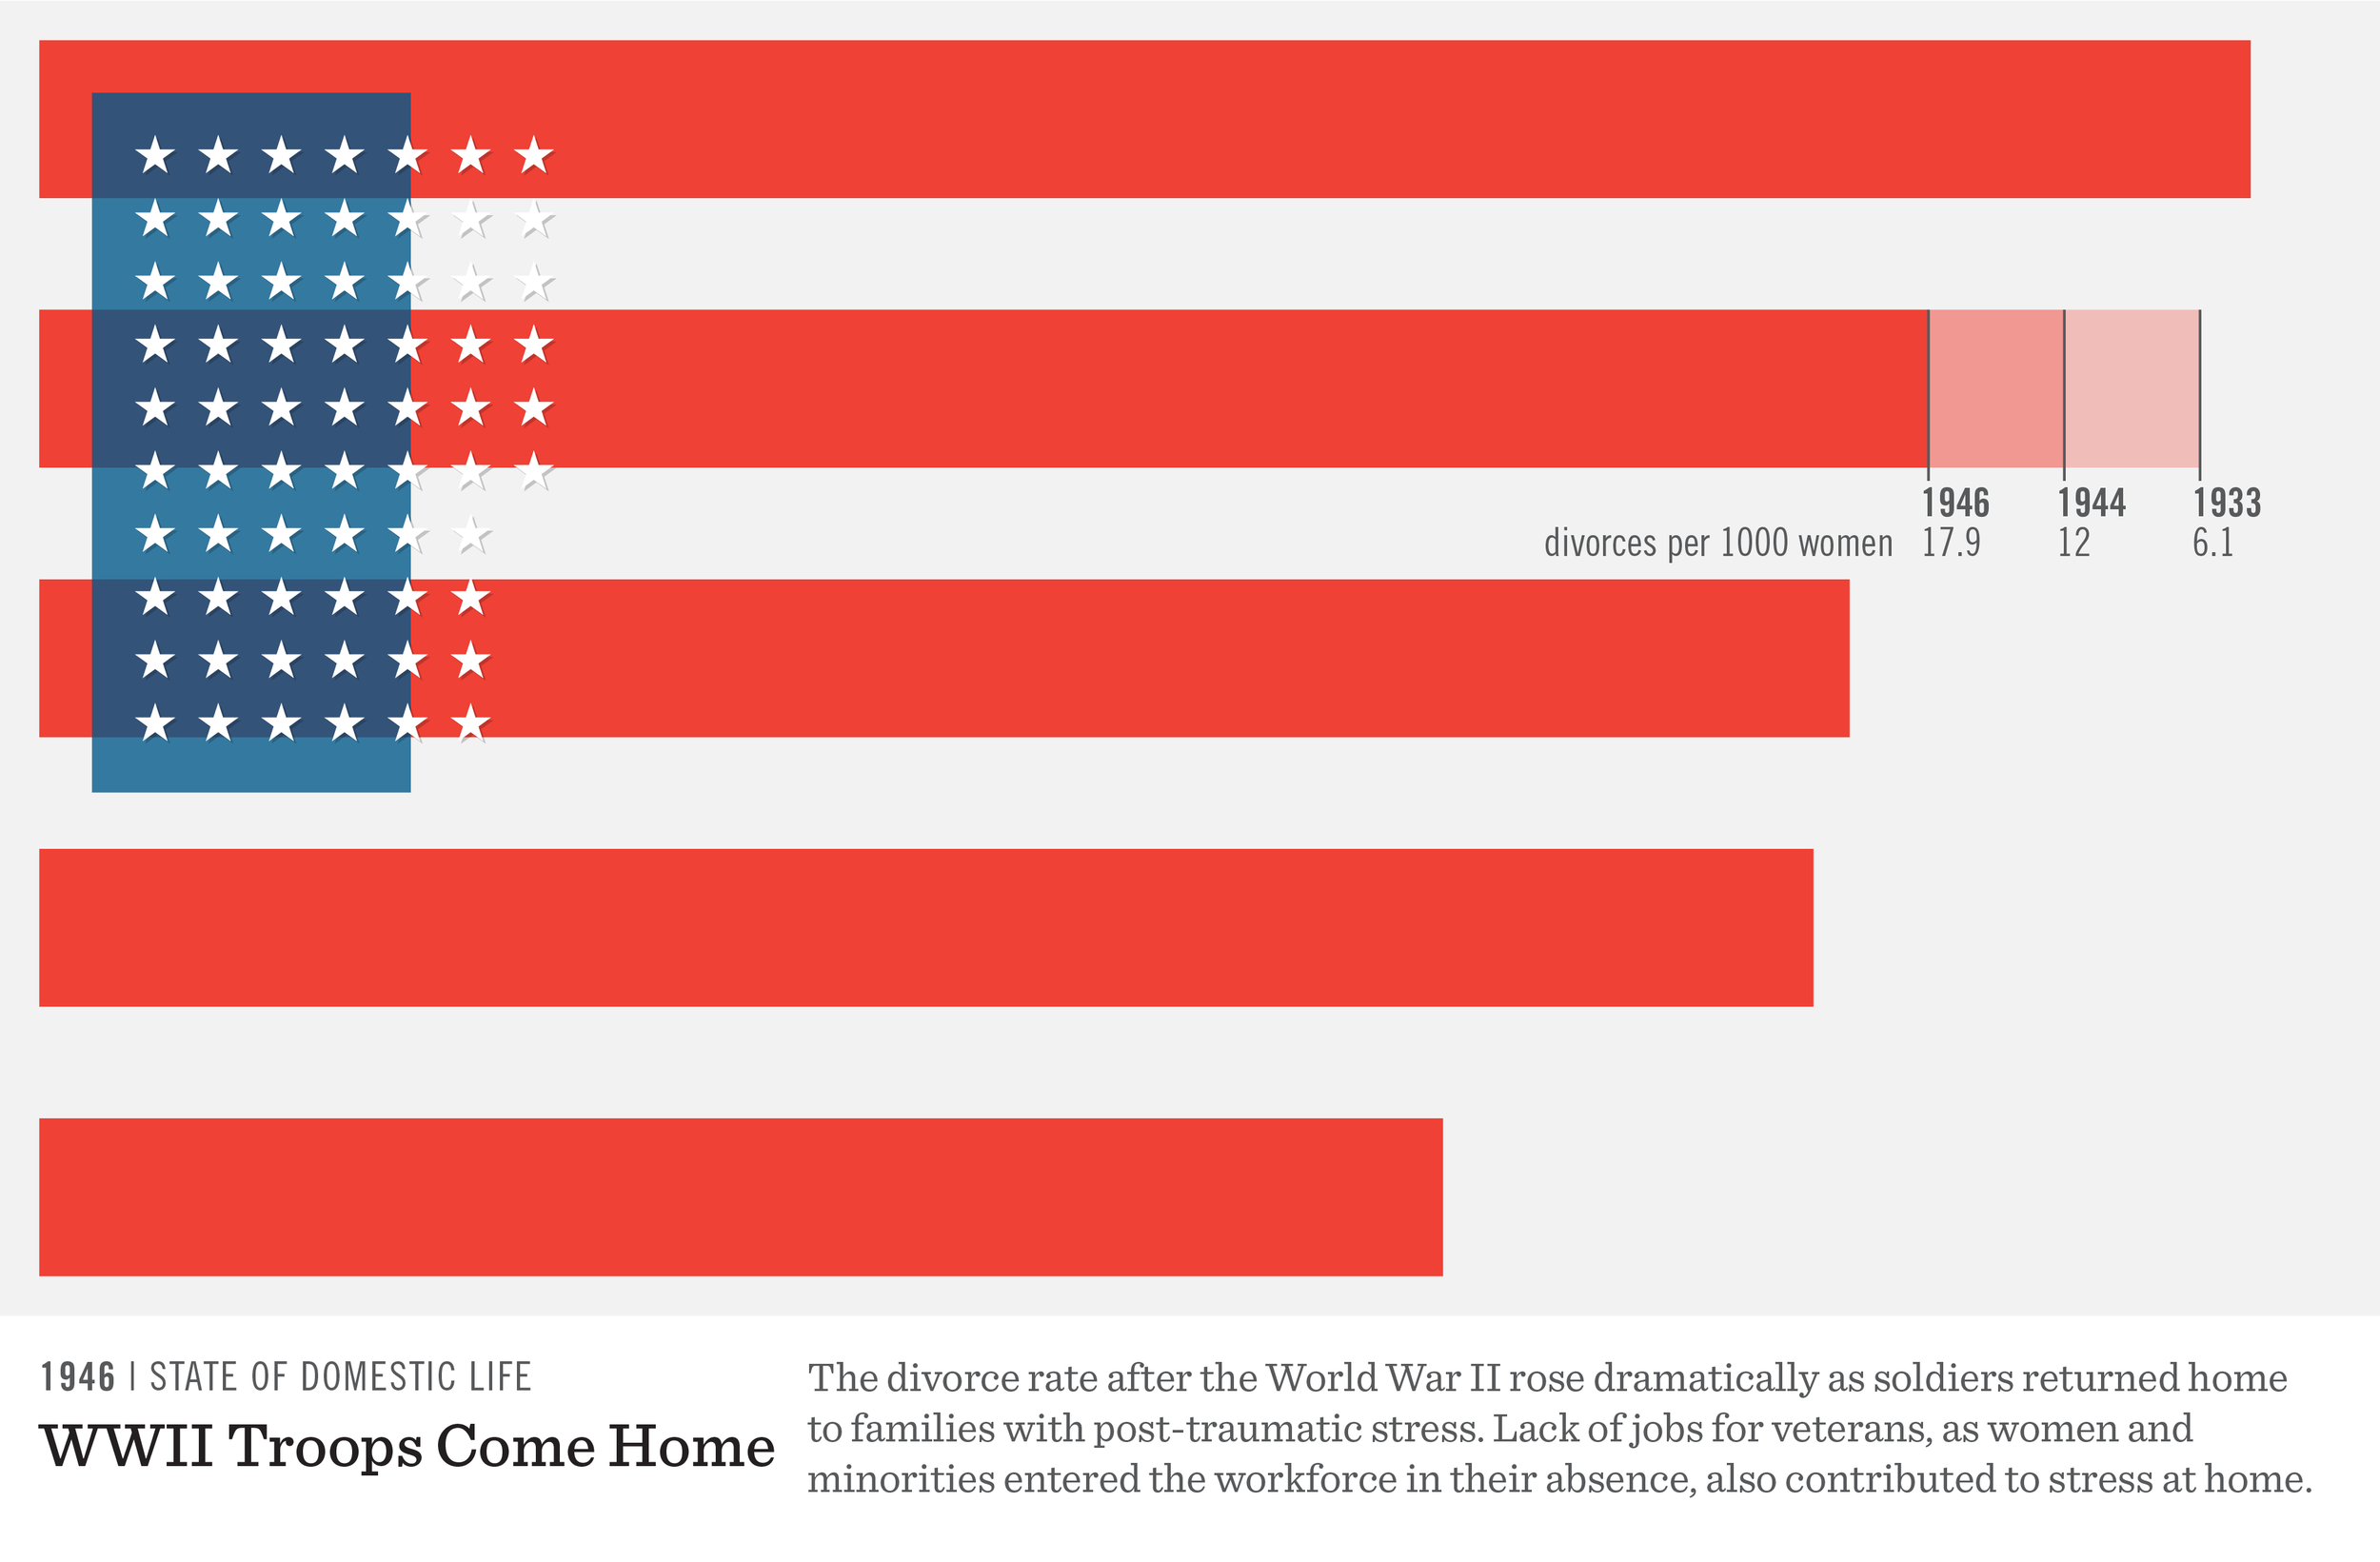
The stars represent each year of life expectancy. The blue field on which they sit stretches based on GDP per capita. The stripes are a sort of horizontal bar graph showing five different socioeconomic metrics: unemployment, divorce rate, homicide rate, school enrollment and gender salary ratios. In some cases, such as the unemployment rate, the stripe grows in an inverse relation to the metric2.

production process

visual strategy and information mapping
The intention is not that one could read numerical meaning. However, over time one could see holistically how a country performed according to its values, such as through the visual completeness of the stripes.
The gestalt of a nation.


Stories in the Data
Breaking out each metric over the last twelve decades, you can see some broad trends. The State of Health, Wealth, Education and Equality have consistently gone up (even when GDP per Capita is adjusted for inflation). The other metrics have ebbed and flowed the last 120 years, but generally are lower than where we were in the late nineteenth century.

While decades can show broad trends, specific years of rapid change contain rich stories of American history. For instance, in a single year influenza knocked down the life expectancy of Americans by seven years. Or how the divorce rate increased significantly as troops came home from WWII with the stresses of war to a changed nation that wasn’t sure how to fit them in.
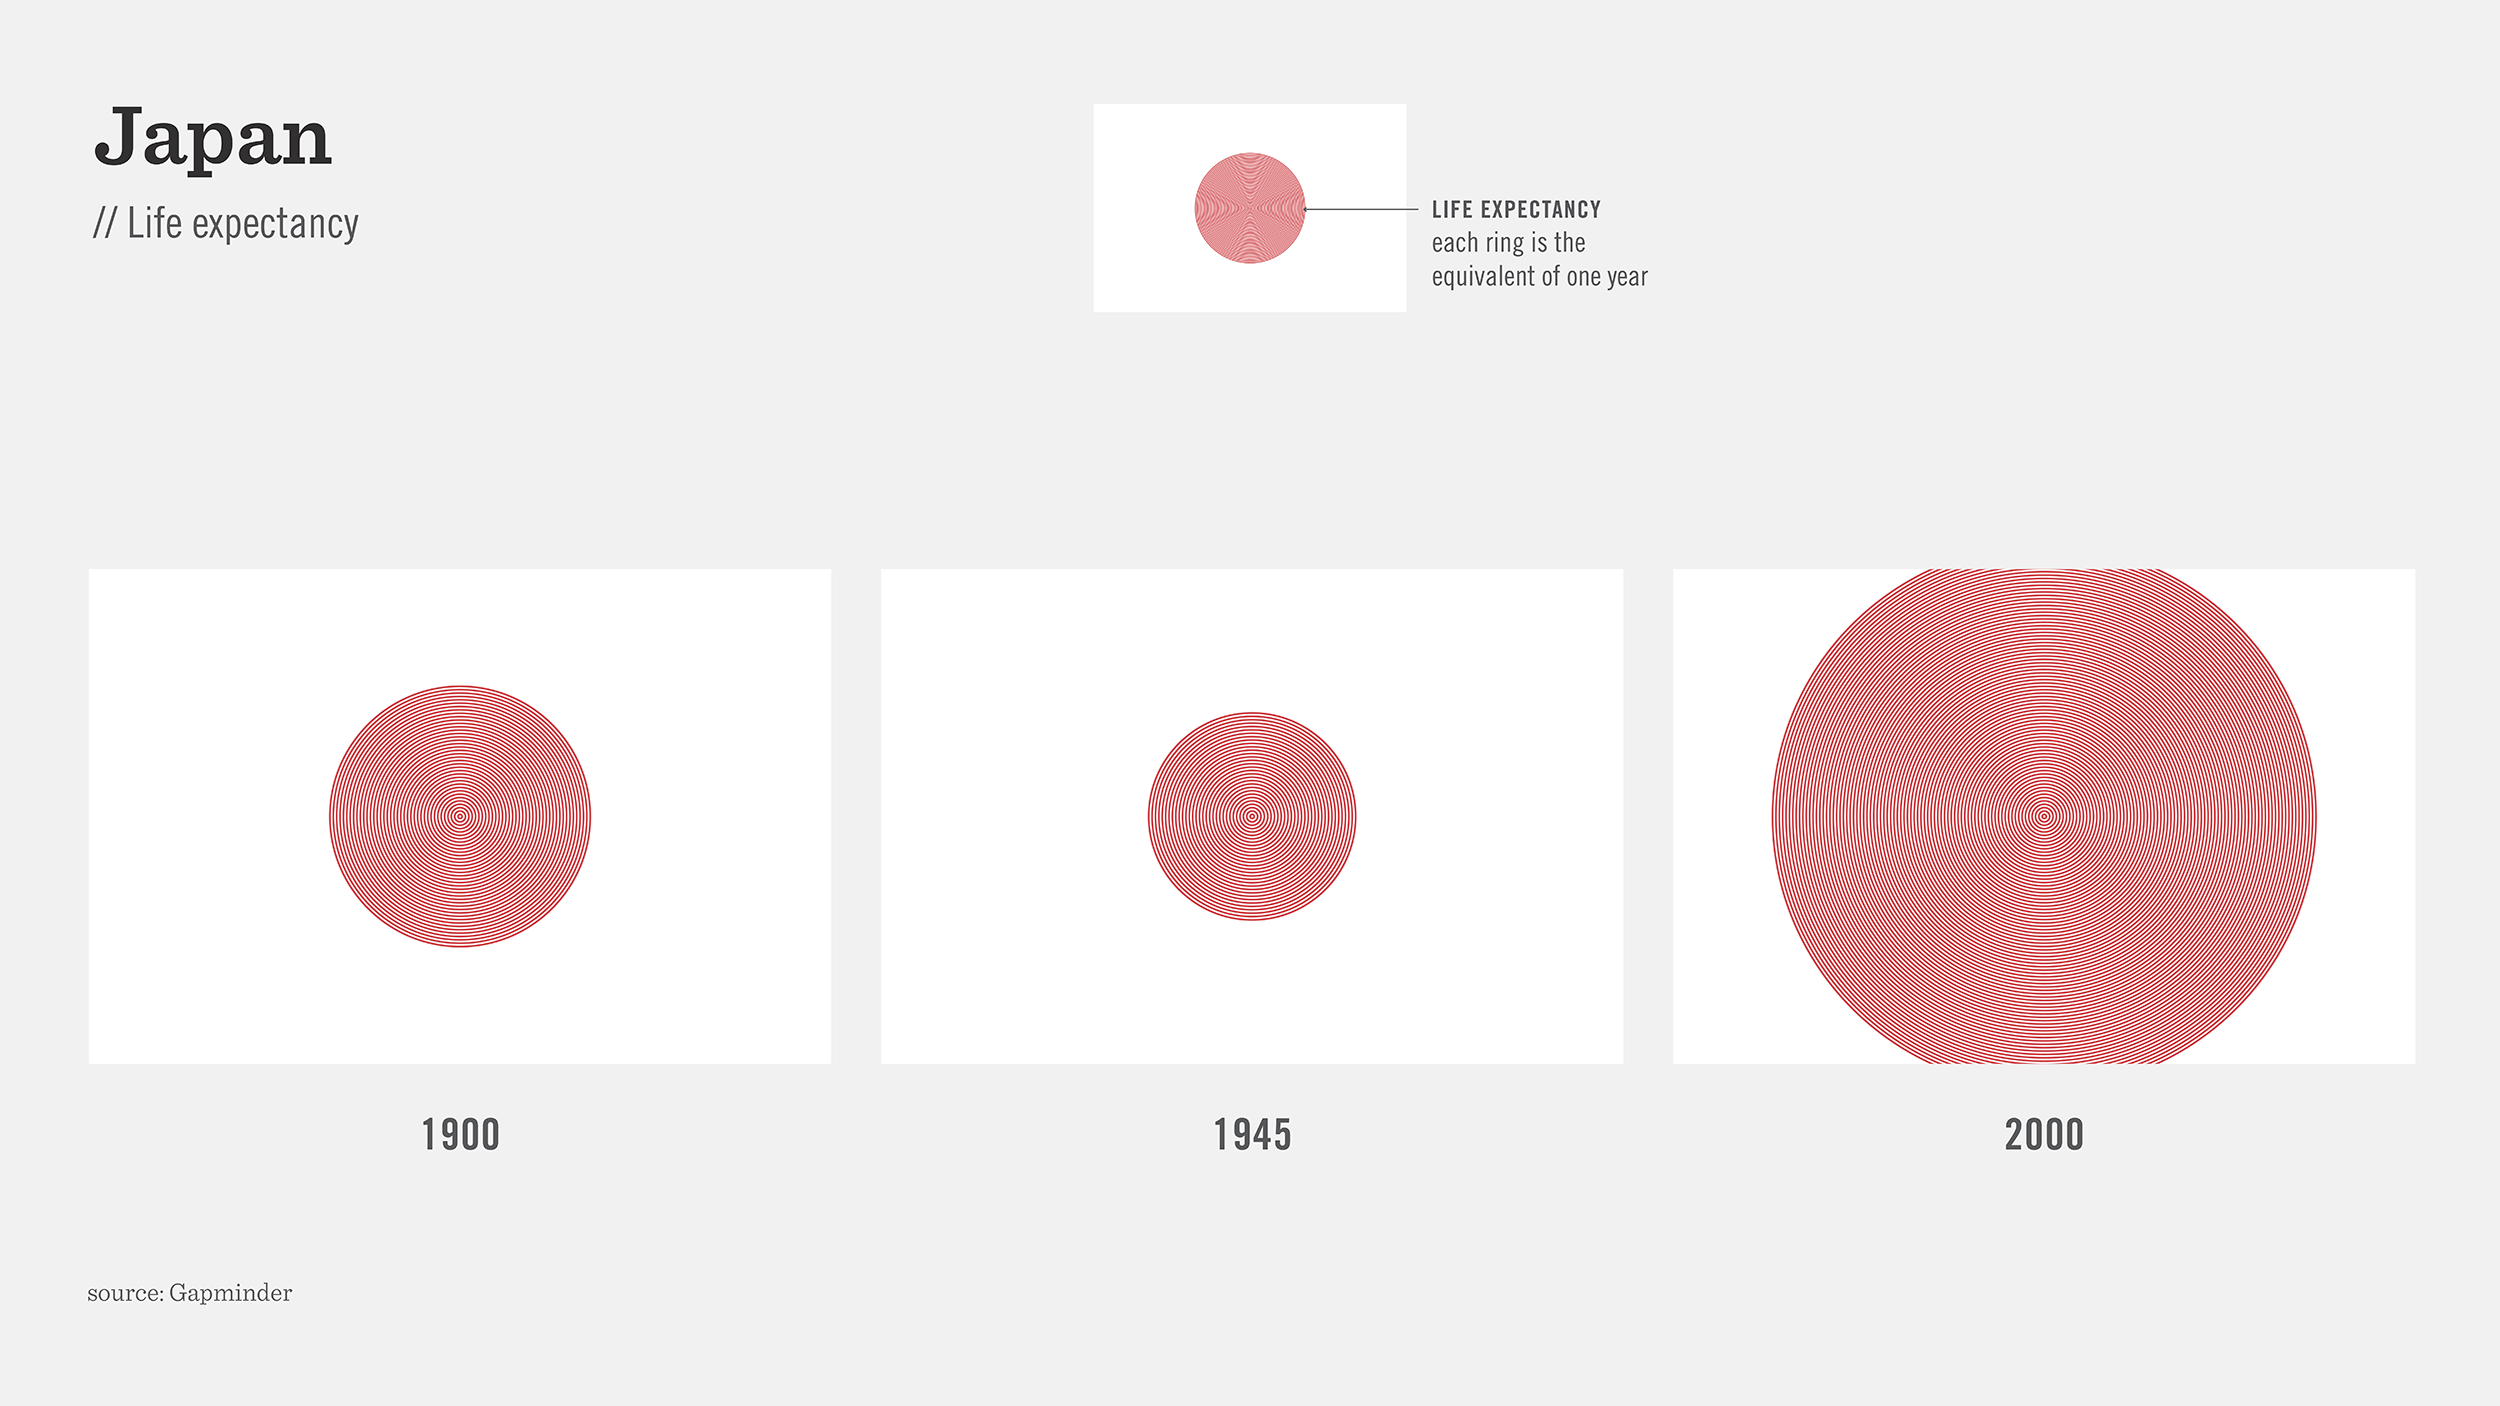
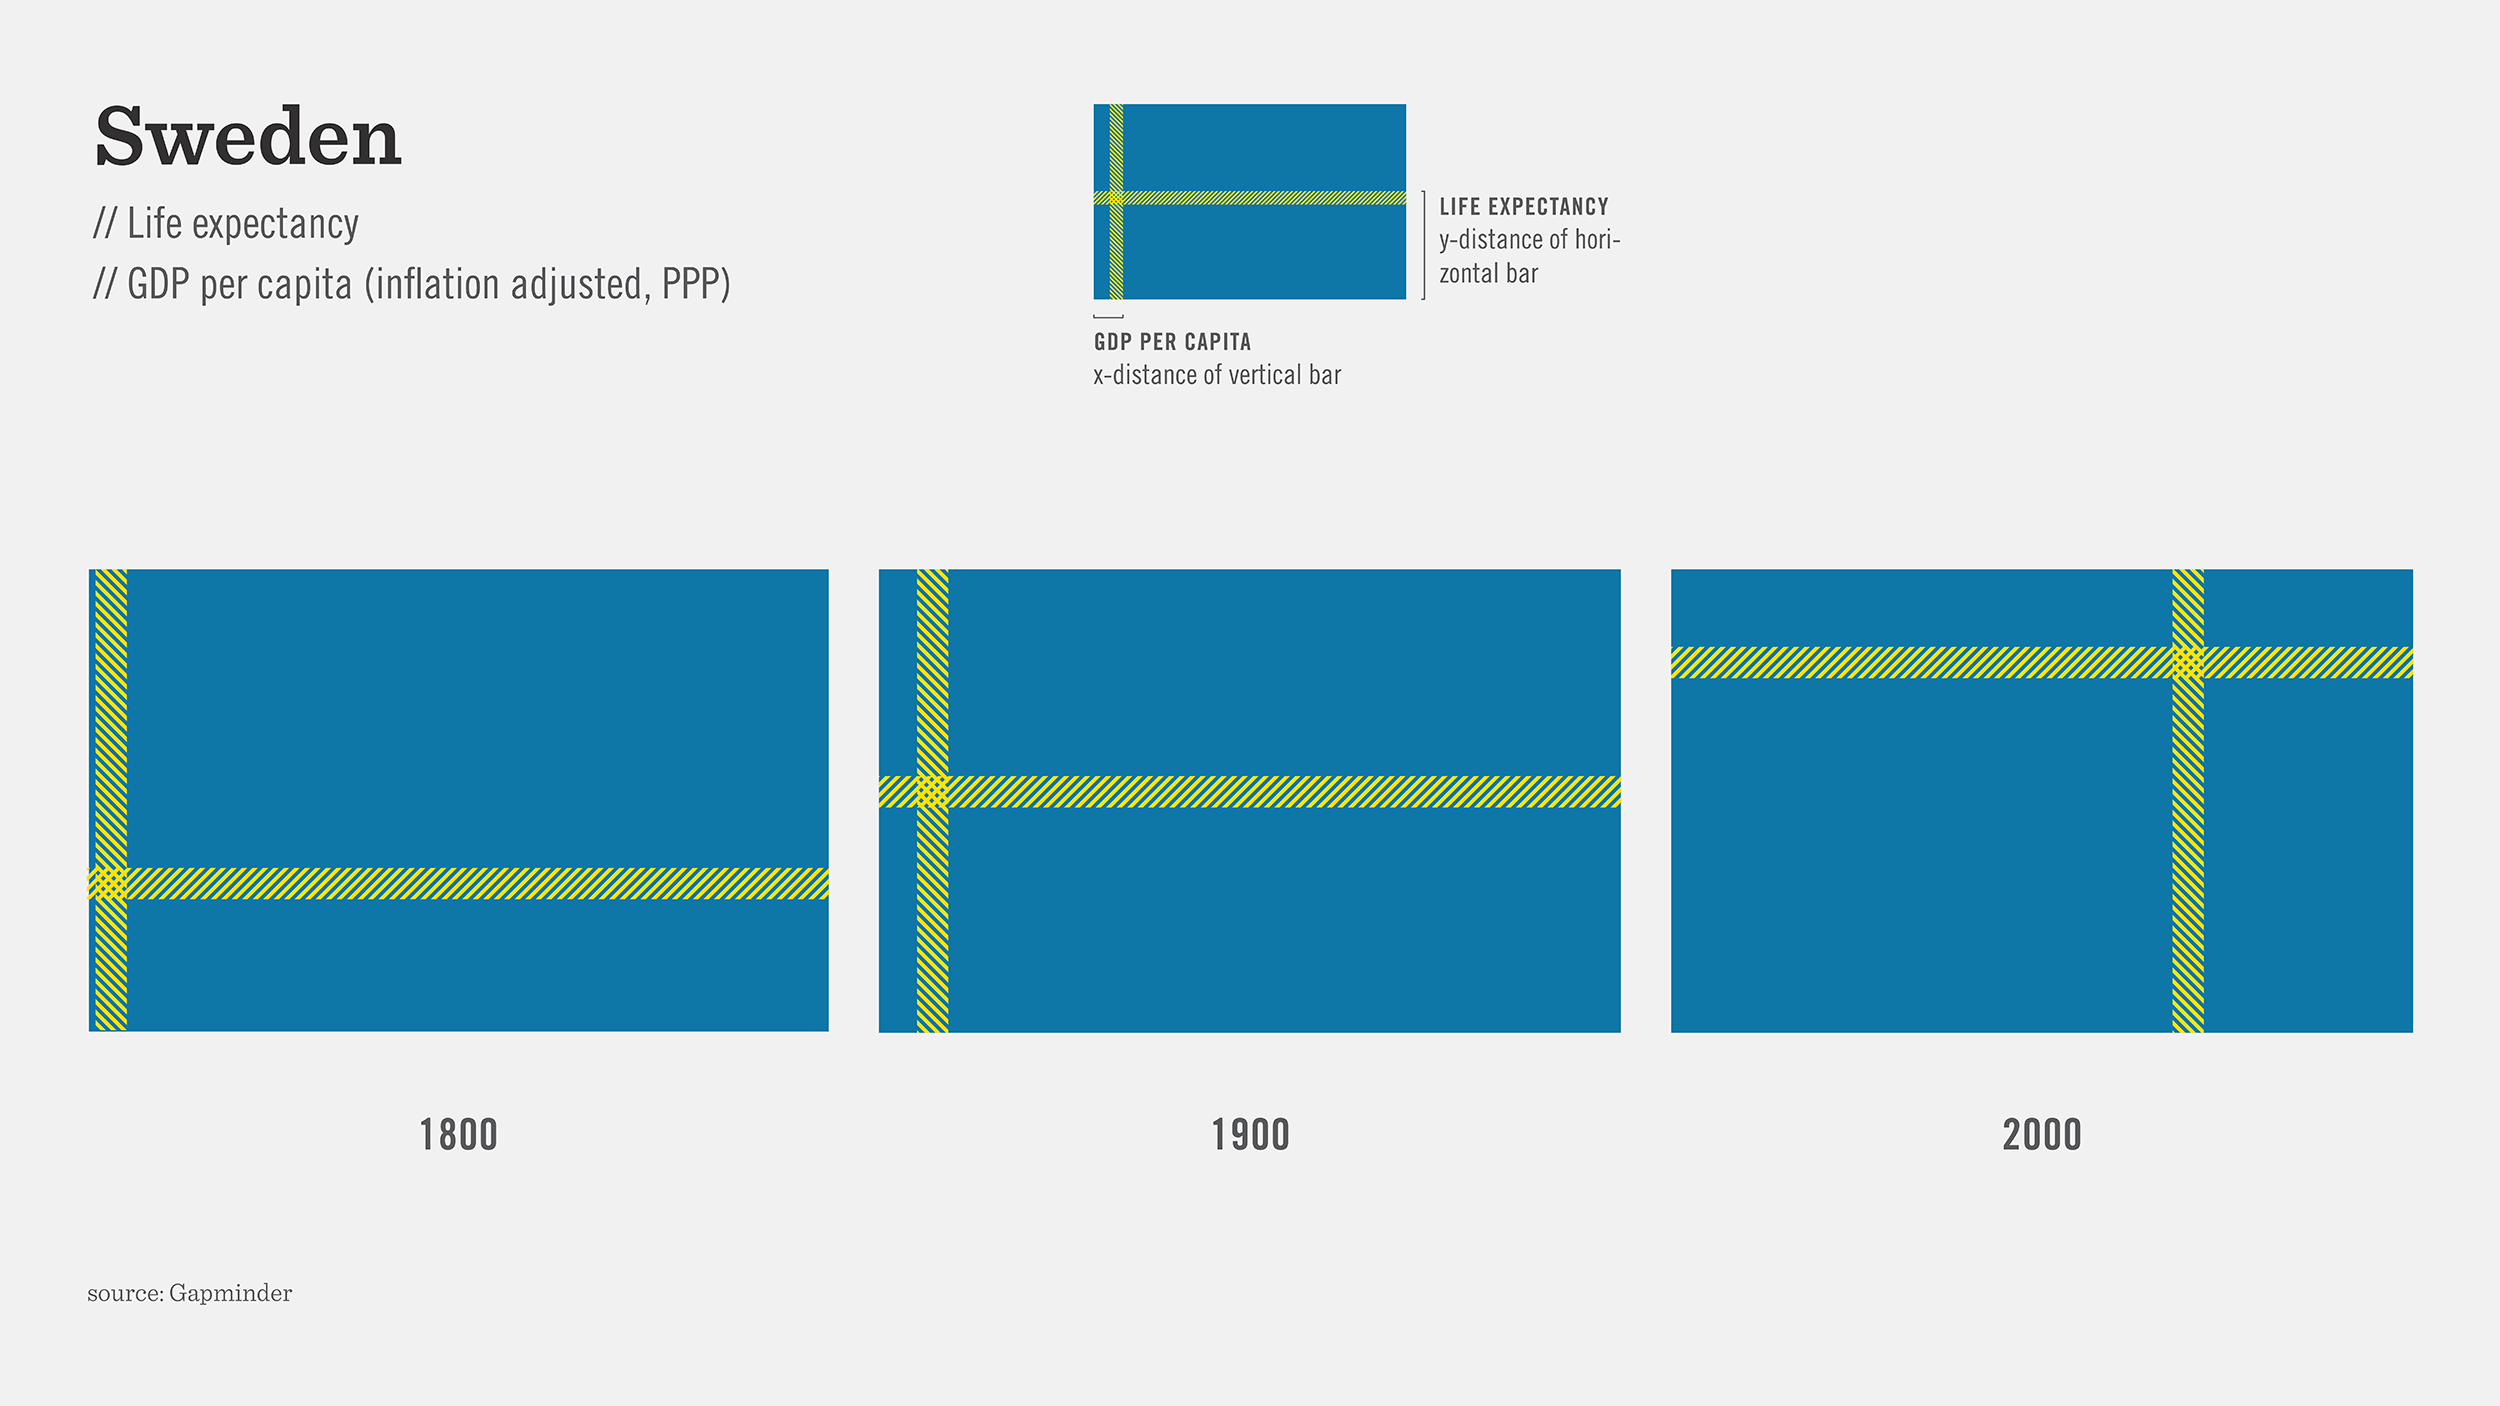
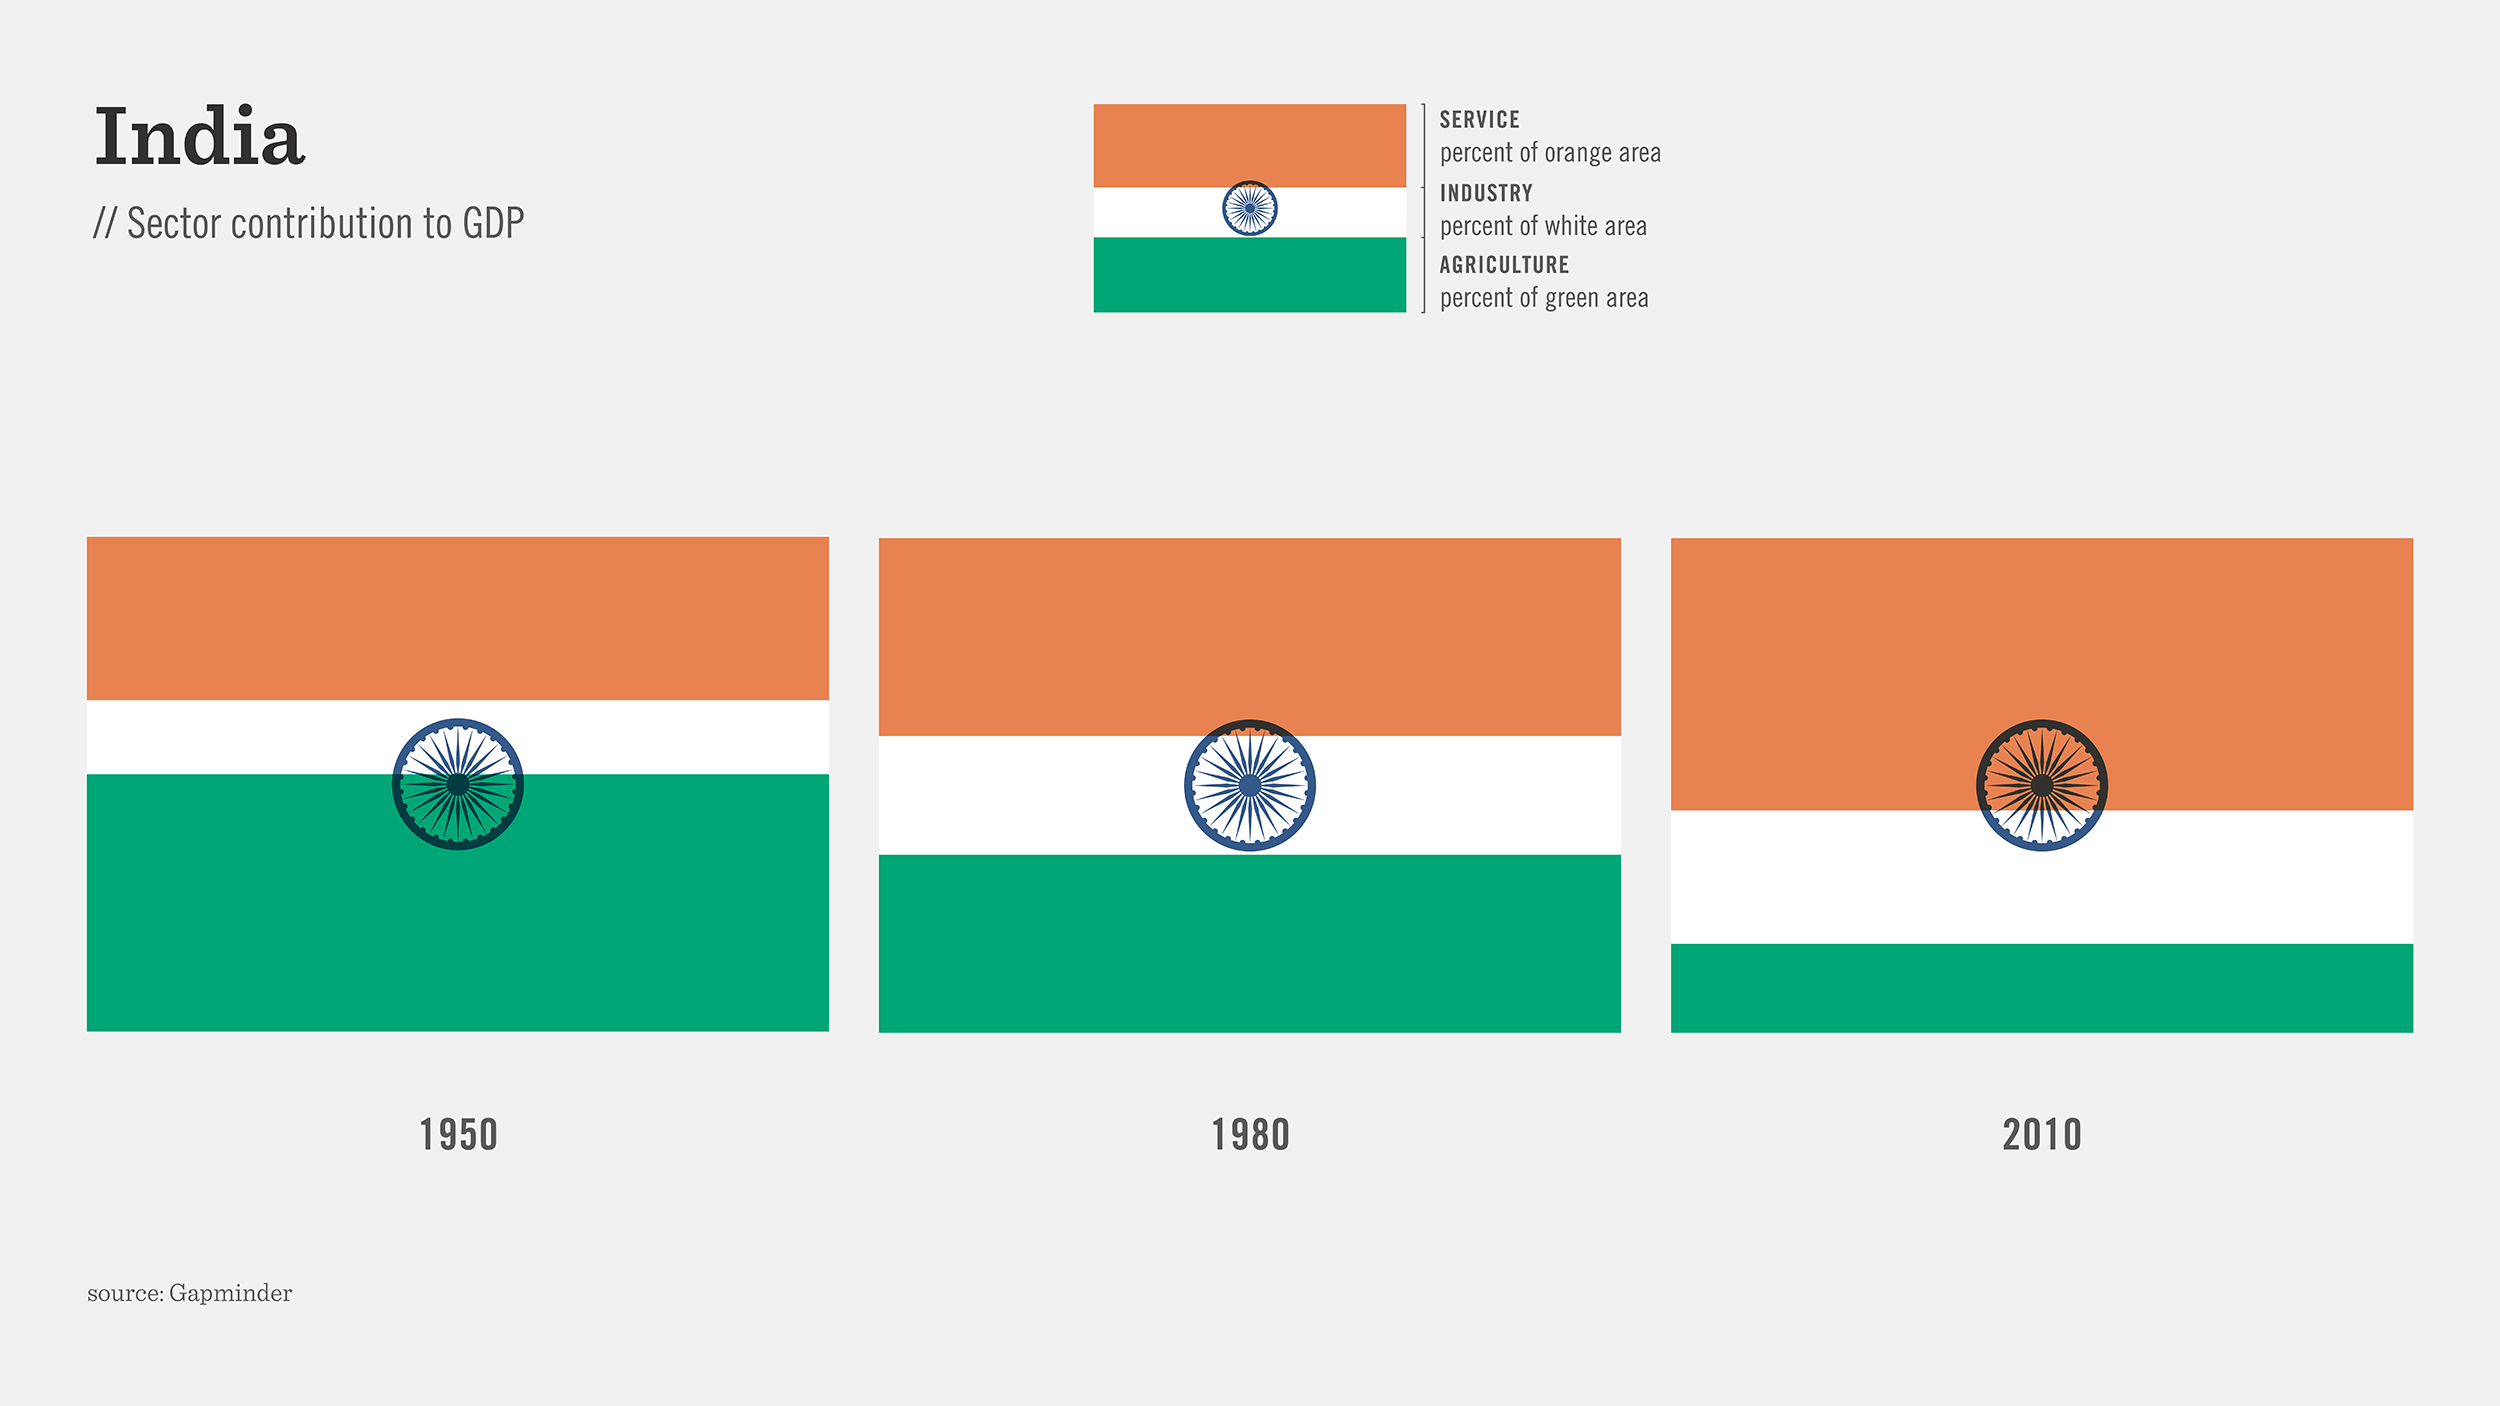
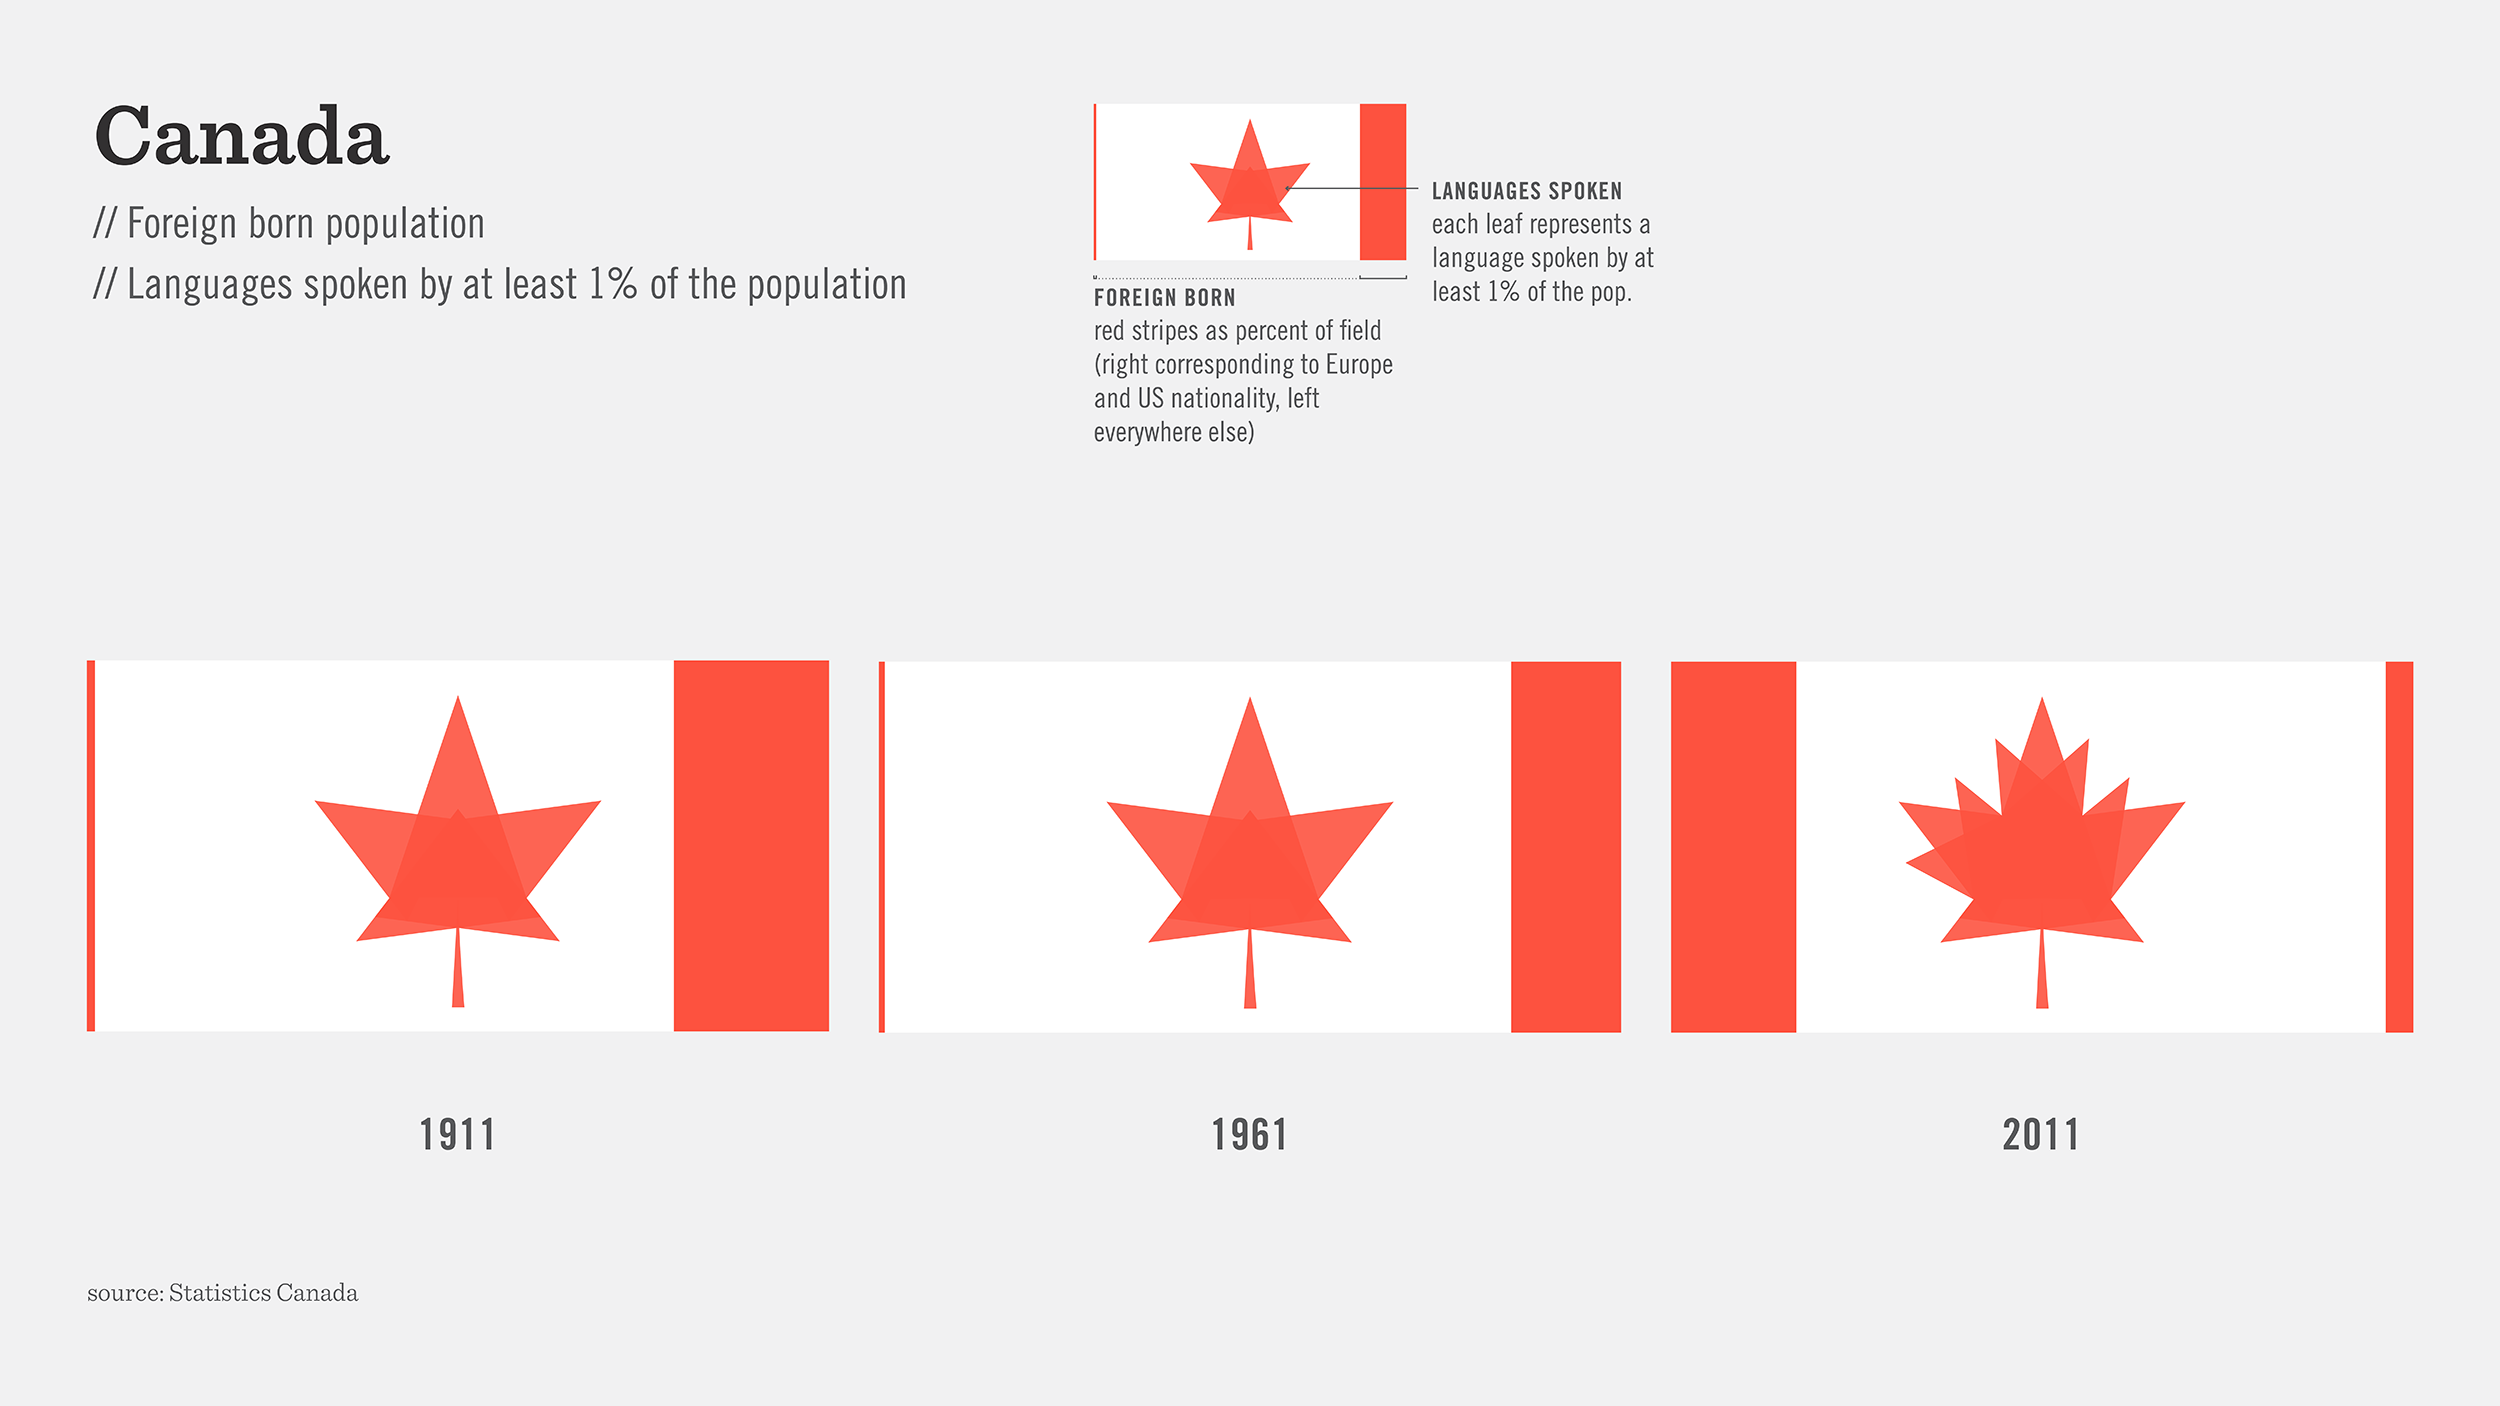
Other Countries
Each country has it’s own values, which makes comparing countries to each other tricky and unnecessary. Rather, each country might choose it’s own metrics to measure (e.g. Canada as a melting pot). Below, you’ll see a few moments in time for other nation’s flags. For instance, the life expectancy of a person in Japan, proudly amongst the highest in the world today, is correlated to the diameter of the circle. While life expectancy tends to go up over time, in 1945 life expectancy was actually lower than it had been almost 50 years prior because of World War II.
Visualizing Everyday Symbols
State of the Union intentionally recasts the flags countries currently fly. It’s a retroactive approach to design. However, one could easily imagine flags looking very different if at the outset they were designed to be data-driven and constantly changing3.
The same could be said for other symbols, like corporate identities. While communication designers have embraced the idea of a dynamic identity systems—a logo whose parts can be rearranged—almost none are driven by real-time information. Imagine the yellow smile at the bottom of Amazon’s logo curving happier as its stock price rises.
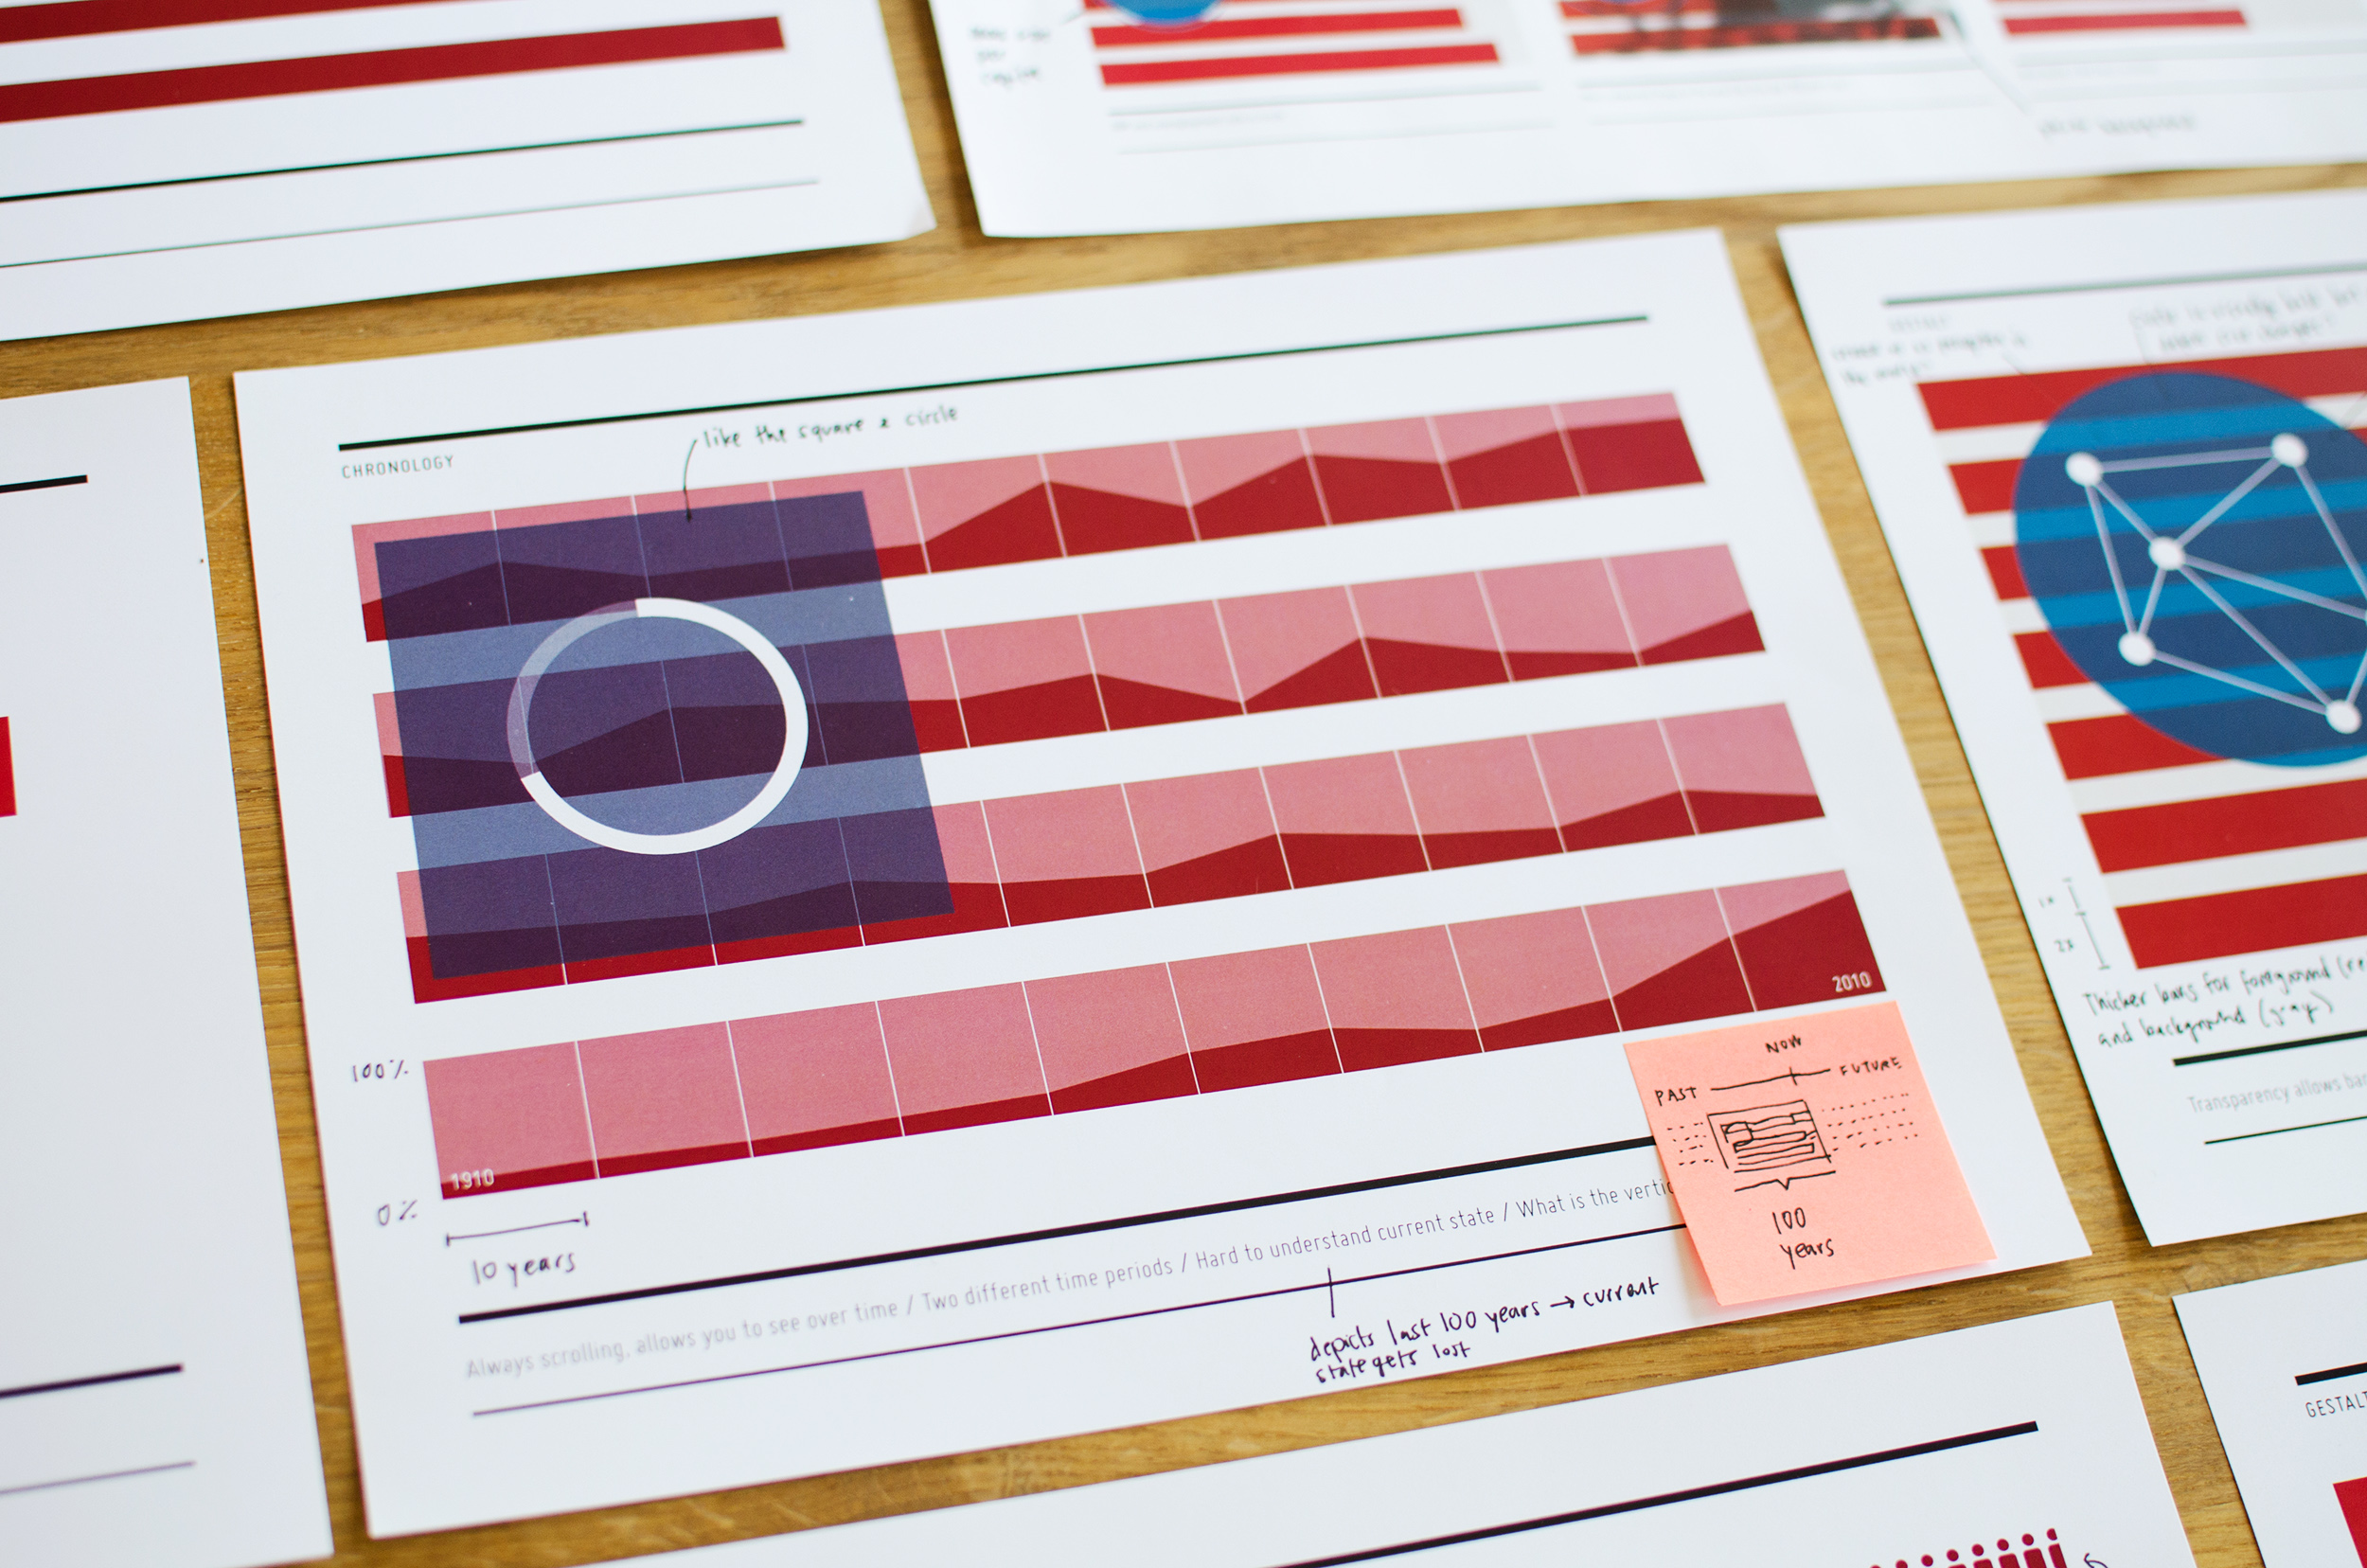
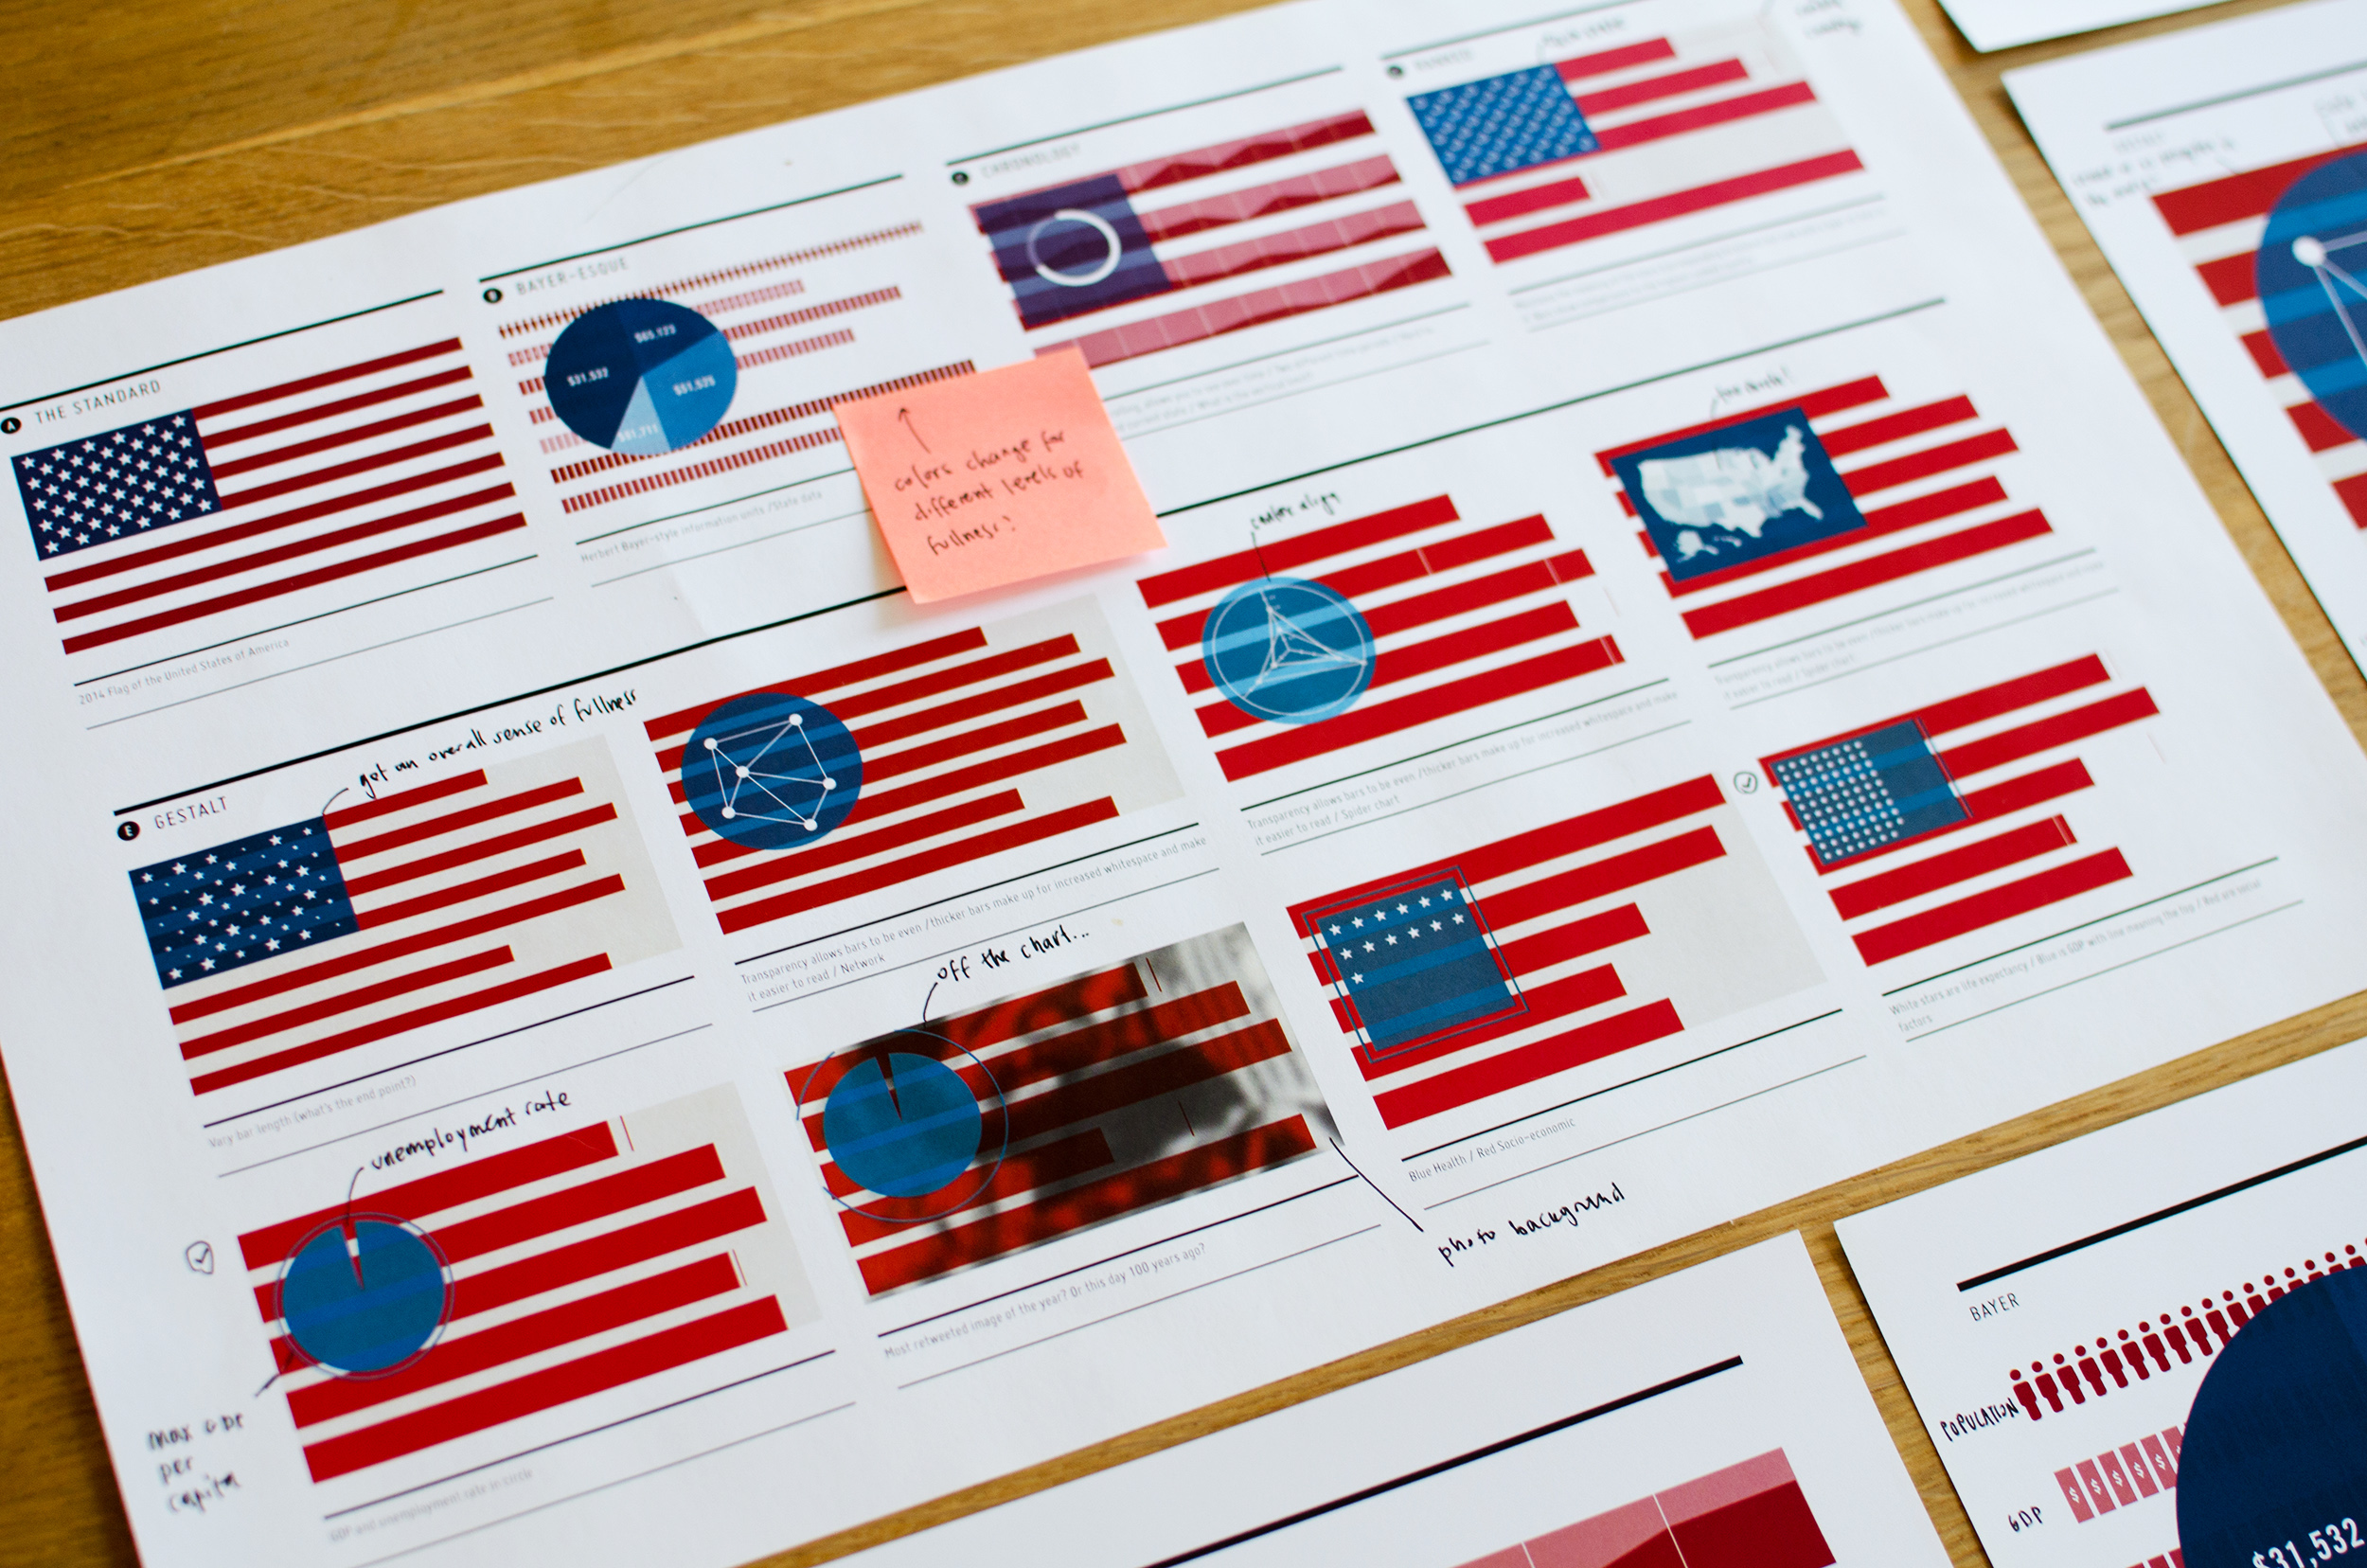
Along the way, I tried other ways of visualizing information on a flag. For instance, using Herbert Bayer’s method of lining up symbols to show quantities. Or thinking of the flag as a constantly scrolling filmstrip, with the data on the most current data coming in from one side and moving across over time. This would allow you to see historical context for the current numbers.
Footnotes:
1. Some data is not captured every year, and therefore is interpolated between measured data points.
2. It’s generally accepted that moving towards right is a good thing. But not achieving 100% completeness might not be a bad thing. Are divorces inherently bad? Maybe a tiny amount of unemployment actually forces the development of new skills.
3. It’s very difficult to design something data-driven for a long view. Who knows if these metrics will be relevant in 100 years? While many of the metics are percentages, those that aren’t could go off the chart. Perhaps the flag is reset every 100 years to reflect the current values, both emotional and numerical.
Sources:
Bureau of Labor Statistics
The Federal Reserve Bank of Minneapolis
The National Center for Health Statistics
The National Marriage Project at the University of Virginia
US Census
World Health Organization
National Center for Education Statistics
Library of Economics and Liberty
Measuring Worth
Gapminder
Statistics Canada
